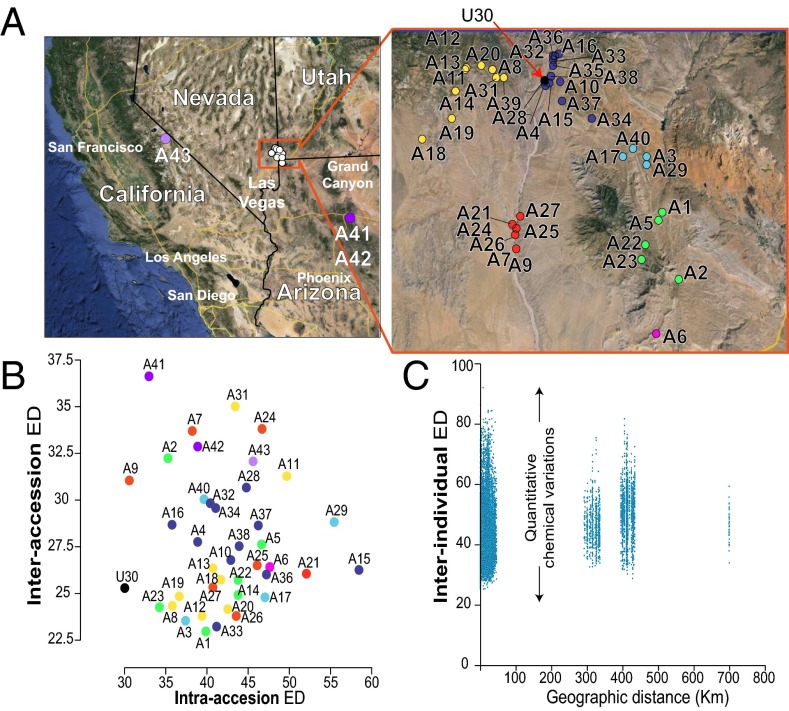
Fig. 1.
Herbivory-induced metabolic profiles of N. attenuata populations exhibit extensive intra- and interaccession quantitative variations. (A) The location of the 43 accession seed collection sites in Utah, Nevada, Arizona, and California. A close-up for the collection sites in Utah is presented. Full GPS coordinates are provided in SI Appendix, Table S1. Colors were arbitrarily given to accessions to highlight accessions collected within the same large geographic region. (B) Classification of accession according to intraaccession (x axis) and interaccession (y axis) Euclidean distances calculated for the complete metabolic profile. As expected, metabolomes of replicated plants from U30, a Utah accession inbred for 30 generations, show low variations. Plants from seeds collected in California and Arizona exhibit higher inter- than intraaccession variations. (C) Scatter plots of Euclidean distances calculated individual sample pairs, demonstrating no clear relationship between geographical distance and metabolic profile variations. Each dot represents one sample pair, and its coordinates correspond to the geographic distance (x axis) and Euclidean distance of the metabolic profiles for this sample pair. Closely related individuals exhibit high quantitative metabolic variation when grown under glasshouse conditions, and no correlation is detected between the geographic and Euclidean distances.

