
Fig. 2.
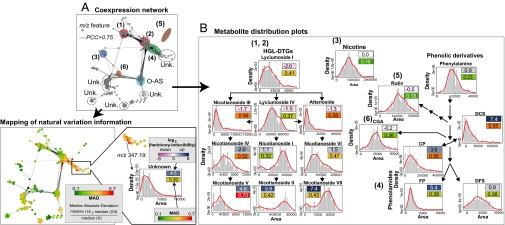
Natural variation affects metabolite inducibility by herbivory at both pathway and single compound scales. (A) Covariance network visualized for metabolite-derived m/z features [Pearson correlation coefficient (PCC) of >0.75, biolayout, based on 1,044 m/z features extracted from 183 samples] obtained by nontargeted postprocessing of N. attenuata accession UHPLC-qTOFMS metabolic profiles indicates pathway-specific and compound-explicit differential inducibility by herbivory and variability through accessions. Different compound classes are annotated using different colored ellipses. Unk., unknown compound class. The resulting network topology was used to map m/z feature-specific natural variation coefficients calculated as relative median absolute distance (relative MAD); the degree of MAD is indicated by the node color from green (low) to red (high). In the MAD formula, Xi represents the ith value across the population for the m/z signal denoted as X. (B) Simplified metabolic schemes and density distribution plots for main intermediates in known secondary metabolic pathways involved in antiherbivore responses in N. attenuata that were extracted from the coexpression network: (diagrams 1 and 2) hydroxygeranyllinalool diterpene glycosides (HGL-DTGs); (diagram 3) nicotine; (diagram 4) phenolamides (CP, N-caffeoylputrescine; DCS, N′,N′′-dicaffeoylspermidine; DFS, N′,N′′-diferuloylspermidine, FP, N-feruloylputrescine); (diagram 5) rutin; (diagram 6) CGA, chlorogenic acid. Distribution histogram plots are overlaid with a density line depict distribution of intensities for known metabolites across the dataset with x axis, area of intensities, and y axis, fitted density with histogram. Nicotine, phenylalanine, rutin, and CGA, which show no to moderate induction by herbivory, exhibit the lowest degree of natural variation in our analysis. Metabolite inducibility is defined as the log2-scaled fold change value between herbivory-induced and control samples of U30 (average fold change from 13 replicates) and is depicted by color boxes ranging from pink (low) to blue (high). The log2-scaled inducibility and relative MAD values are reported in the corresponding boxes. Statistics for log2-scaled fold changes are reported in Dataset S1.