Fig. 2.
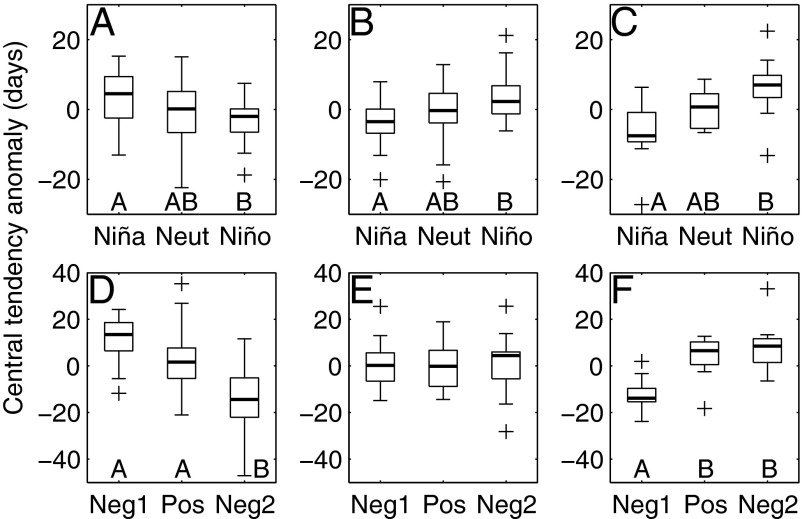
Effects of El Niño-Southern Oscillation (A–C) and Pacific Decadal Oscillation (PDO; D–F) on species displaying earlier phenology (Left; n = 60), no long-term, linear change in phenology (Center; n = 66), and later phenology (Right; n = 27). In each box plot, the darkened line indicates the median; boxes show the interquartile range; whiskers indicate the expected extent of 99% of the data for a Gaussian distribution, and crosses show outliers. Two outliers fall outside the range displayed in A. Capital letters below boxes indicate means that differ significantly at P < 0.05 based on Tukey-Kramer multiple comparison tests. (A–C) El Niño, neutral (Neut), and La Niña conditions based on the Oceanic Niño Index. (D–F) Neg1, cold-phase PDO between 1951 and 1976; Pos, warm-phase PDO from 1977 to 1998; Neg2, cold-phase PDO during 1999–2002 and 2007–2008.

