Fig. S2.
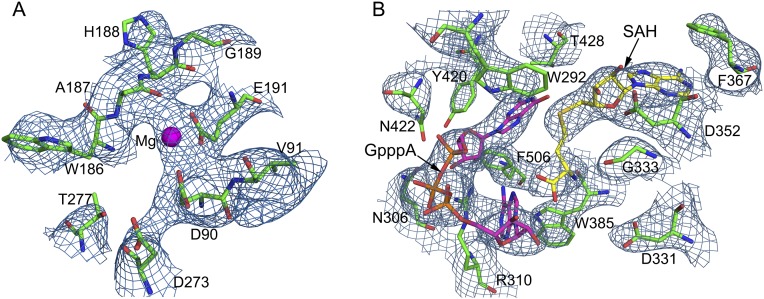
2Fo-Fc maps of the active centers of nsp14. The electron density for the ExoN catalytic center (A) and the N7-MTase catalytic center (B) are contoured at 2σ. Amino acids surrounding the catalytic centers and substrates SAH and GpppA are shown as sticks, and Mg2+ is shown as a magenta sphere.

