Fig. 5.
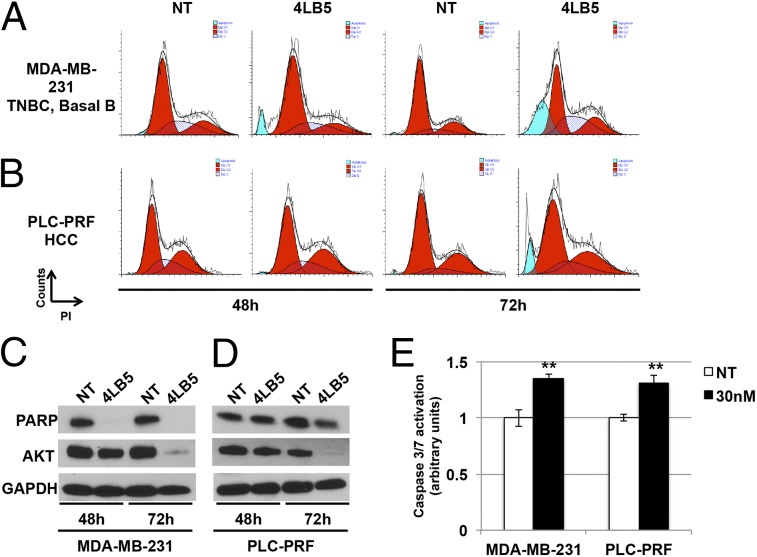
4LB5 induces apoptosis. (A and B) Cell cycle analysis of MDA-MB-231 (A) and PLC-PRF (B) cells by propidium iodide staining, treated or not (NT, not treated) with 240 nM 4LB5 for 48 h and 72 h. Red peaks indicate cells in G1 and G2 phase of the cell cycle. Stripes indicate cells in S phase. Blue peaks indicate sub-G1 apoptotic cells. Data are representative of three independent experiments. (C and D) Western blot analysis of total lysates from cells treated as in A and B to evaluate inactive-PARP cleaveage and AKT levels. GAPDH was used as loading control. (E) Caspase 3/7 activation assay performed on MDA-MB-231 and PLC-PRF cells 24 h following the treatment with 30 nM 4LB5 or control vector (NT). **P < 0.01. Data are representative of three independent experiments performed in triplicate.

