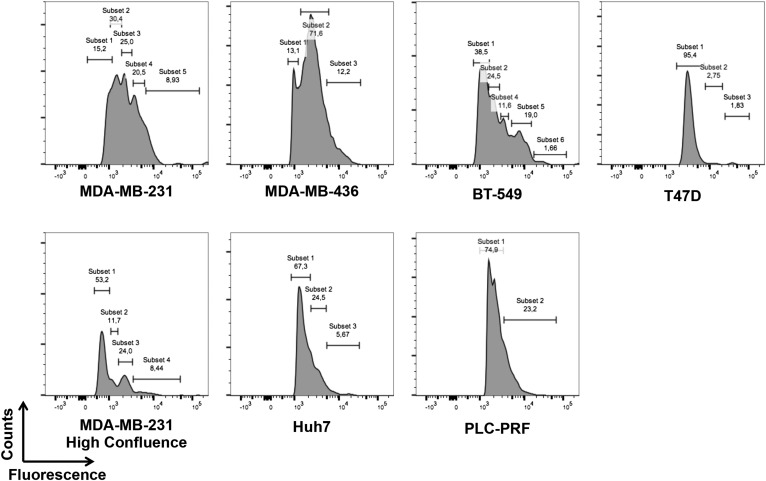
Fig. S4.
Heterogeneous levels of surface NCL on the cancer cell lines used in the study. Indicated cell lines were stained using a commercially available anti-NCL antibody and analyzed by flow cytometry using the FlowJo software. The relative abundance of different subpopulations, expressing different levels of surface NCL, is reported.

