Fig. 2.
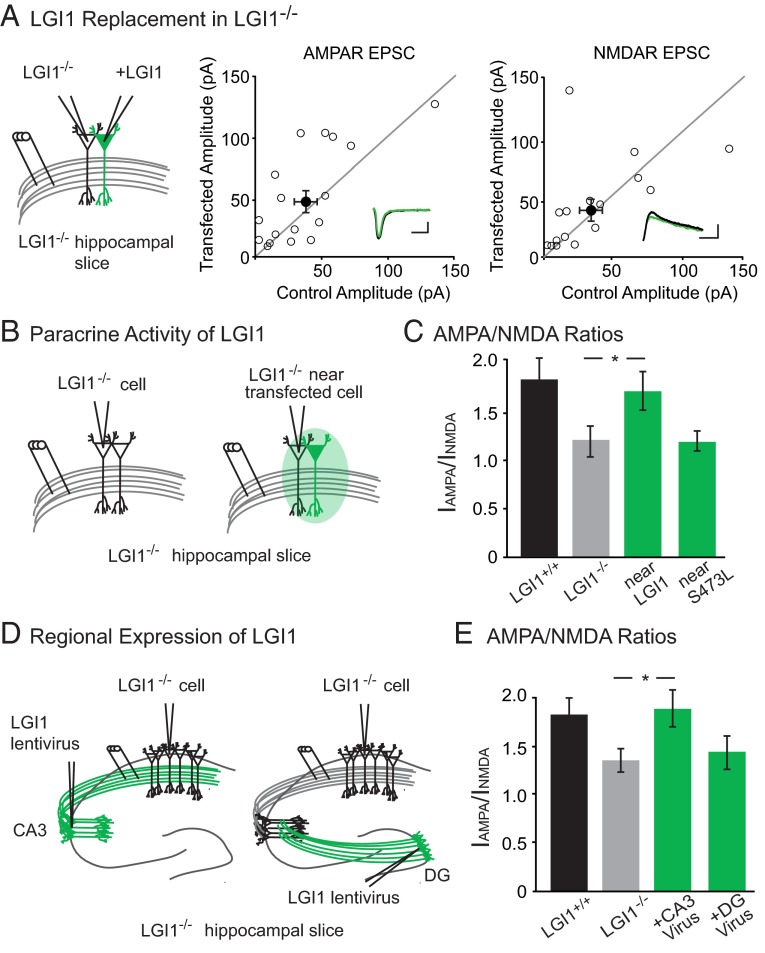
LGI1 is a paracrine signal derived from the pre- and postsynaptic cell. (A) AMPAR- and NMDAR-mediated EPSCs in LGI1−/− cells expressing LGI1 are the same as neighboring untransfected LGI1−/− cells (AMPAR: P = 0.17, n = 17; NMDAR: P = 0.37, n = 16). Scatterplots show individual dual recordings (open circles) and mean ± SEM (filled circle). (Insets) Sample traces of LGI1−/− (black) and LGI1−/− + LGI1 (green). (Scale bars, 50 ms and 50 pA.) (B) Recording set-up of naïve control cell in LGI1−/− slice and control cell near (either adjacent to or one cell body away from) an LGI1-transfected cell in LGI1−/− slice. (C) The AMPA/NMDA ratio of nearby control cells in LGI1−/− biolistically transfected slices is significantly higher than cells from naïve LGI1−/− slices (P = 0.03, n = 15). LGI1S473L expression, however, does not alter the AMPA/NMDA ratio of nearby cells relative to naïve LGI1−/− cells (P = 0.71, n = 13). Bar graphs show mean ratio ± SEM. (D) Viral injections of LGI1 in CA3 (presynaptic) and dentate gyrus (DG, nonsynaptic) were carried out to test the source of active LGI1. Recordings were made in CA1 pyramidal cells for both experiments. (E) Expression of LGI1 in CA3 significantly increases the AMPA/NMDA ratio of CA1 neurons relative to naïve LGI1−/− neurons (P = 0.05, n = 15 LGI1−/−, n = 16 CA3-expressing LGI1−/−); AMPA/NMDA ratios remain similar to naïve LGI1−/− when LGI1 is expressed in the DG (P = 0.82, n = 15 LGI1−/−, n = 20 DG-expressing LGI1−/−). Bar graphs show mean ratio ± SEM.

