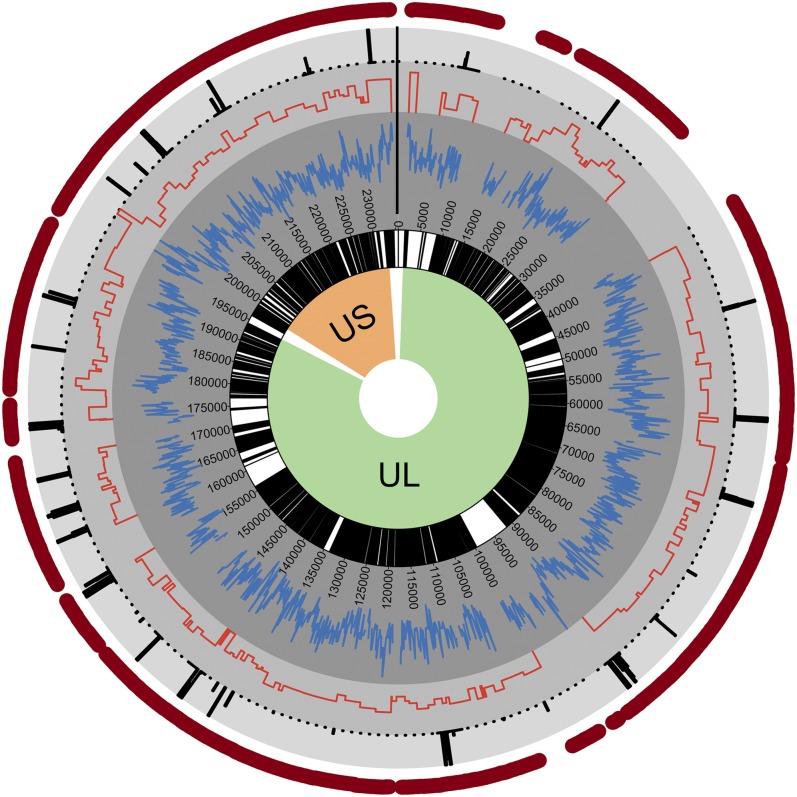
Fig. 2.
Diversity across the HCMV genome. Shown is a circular plot of the HCMV genome, with green and orange shading denoting the unique long (UL) and unique short (US) regions, respectively. Within the inner circle, white indicates noncoding regions and black marks all ORFs. Plotted in gray concentric circles, from the center to the outer regions, are SNP density, nonsynonymous SNP density, and –log(q values) from a statistical test of low SNP density. Only significant q values (≤0.01) are plotted. The outer red circle highlights regions with sufficient coverage to accurately quantify diversity (≥24 samples) (Fig. S1).

