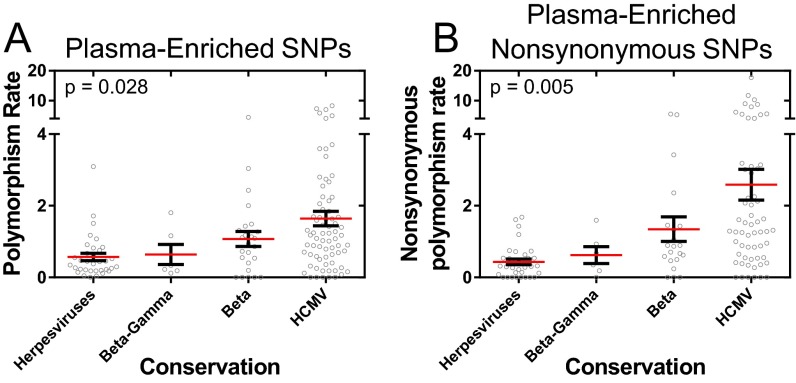
Fig. S4.
Distribution of plasma-enriched SNPs by ORF conservation. ORFs were classified according to herpesvirus conservation, and the rate of plasma enriched SNPs (A) or plasma-enriched nonsynonymous SNPs (B) was plotted for each conservation class. P values represent results from a Kruskal–Wallis analysis. Polymorphism rate in A corresponds to plasma-enriched SNPs per 100 bp of coding sequence, and nonsynonymous polymorphism rate in B is plasma-enriched nonsynonymous SNPs per 100 codons. Core genes are conserved in the Alpha-, Beta- and Gammaherpesviridae, Beta-Gamma are conserved in the Beta- and Gammaherpesviridae, Beta are conserved in the Betaherpesviridae, and HCMV genes are not conserved across species. Red bars mark the group mean and black bars mark the SEM.

