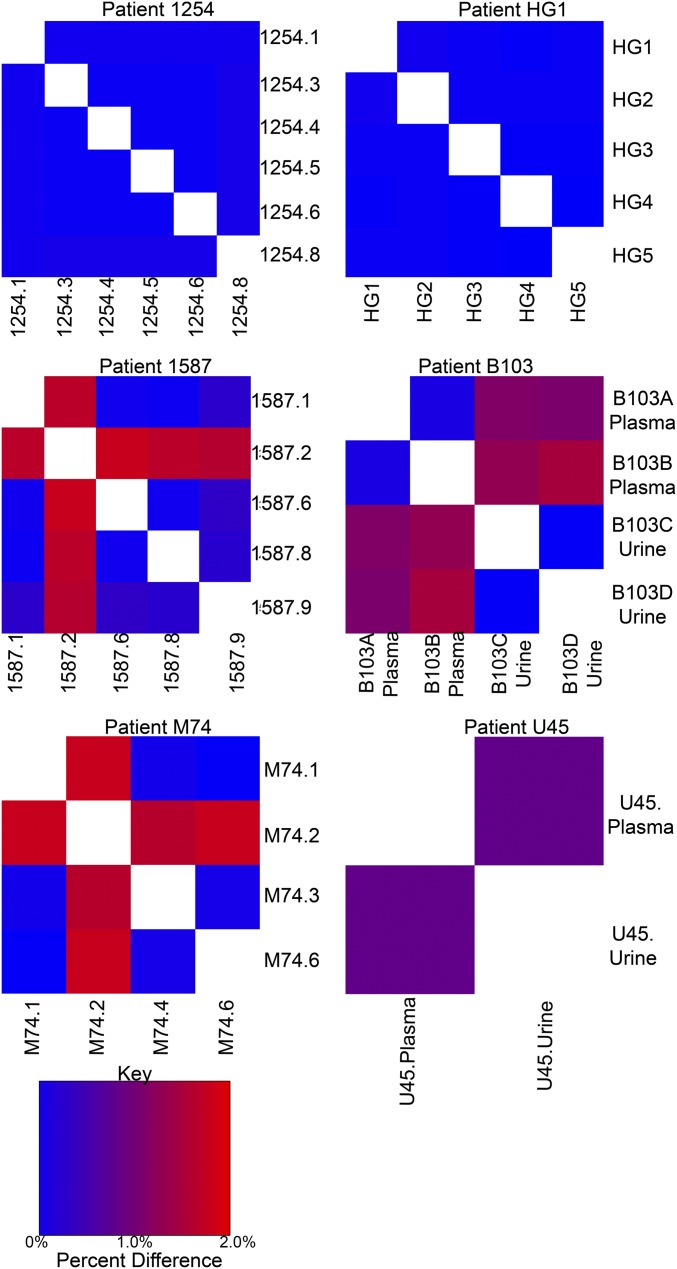
Fig. S6.
Similarity of samples collected from putatively single or mixed strain infections. PCA was used to identify putatively single or mixed strain infections. Patients 1254 and HG1 were assigned as putatively single strain infections, and patients 1587, B103, M74, and U45 were putatively mixed strain infections. The consensus sequences from these samples were then aligned to calculate consensus sequence percent difference for all single patient pairwise comparisons. The percent differences are plotted as a heatmap with values ranging from 0 (blue) to 2% (red).

