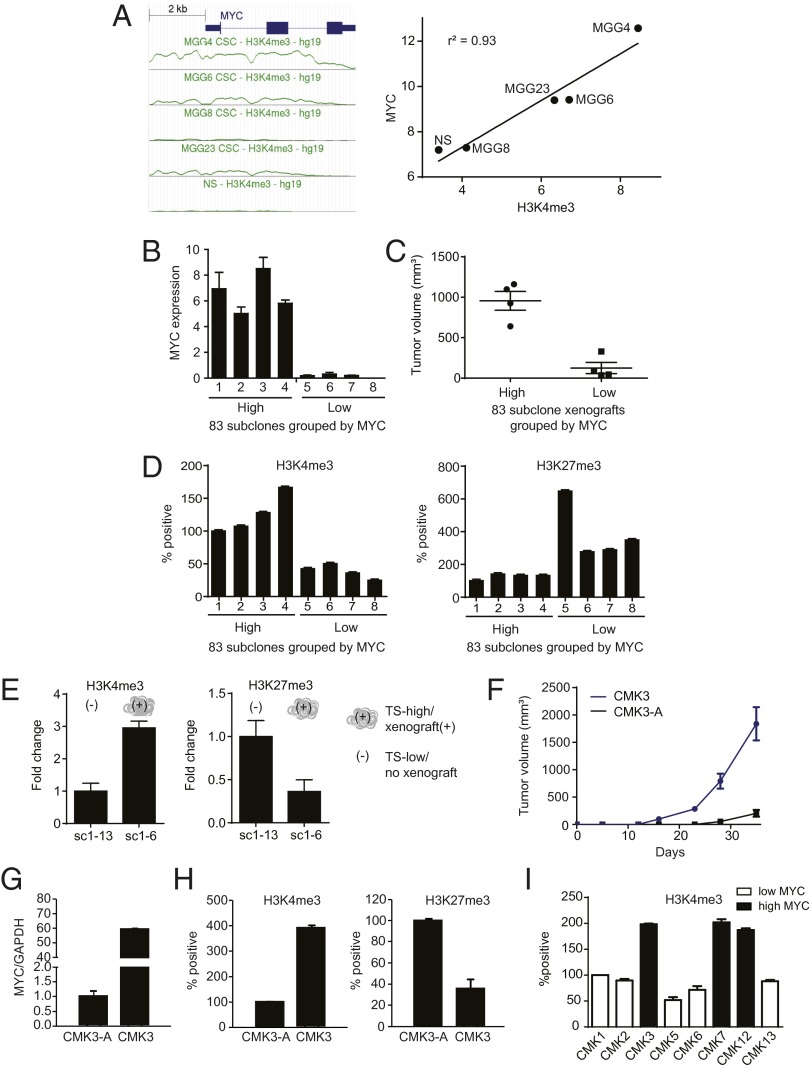
Fig. 4.
Tumorigenicity is associated with histone 3 trimethylation favoring high MYC expression. (A) ChIP-seq analysis of MYC locus (MYC gene + 2 kb upstream) H3K4me3 abundance in four glioblastoma (CSC) lines and a NSC line (31) (Left) revealed an association between H3K4me3 abundance and MYC expression. (Right) Mean abundance of MYC locus H3K4me3 plotted against MYC expression and analyzed by linear regression. (B) Assessment by RT-PCR of relative MYC expression in eight subclones of the glioblastoma line 83 (14). (C) Association of MYC expression and s.c. flank xenograft tumor growth among the eight 83 subclones. (D) Association of MYC locus H3K4me3/H3K27me3 (by ChIP), MYC expression, and tumorigenicity in the eight 83 subclones. (E) Association of MYC locus H3K4me3/H3K27me3 (by ChIP) and tumorigenicity in U87MG-SC1 subclones differing in tumorigenicity (Fig. 1C, exp 2). (F) Comparison of volumetric growth of nude mouse s.c. flank xenografts of a primary glioblastoma line propagated under TS (CMK3) versus adherent/serum (CMK3-A) conditions; n = 5 per group. (G) Culturing conditions that suppressed CMK3 tumorigenicity (CMK3-A) decreased MYC expression (qRT-PCR). (H) Culturing conditions that suppressed CMK3 tumorigenicity (CMK3-A) decreased MYC locus H3K4me3 while inducing MYC locus H3K27me3 (ChIP). (I) Association between MYC expression and MYC locus H3K4me3 in a panel of eight freshly resected glioblastoma specimens, including three that are tumorigenic and show high MYC expression and five that are nontumorigenic and show low MYC expression (Fig. 2E). All error bars, SD.

