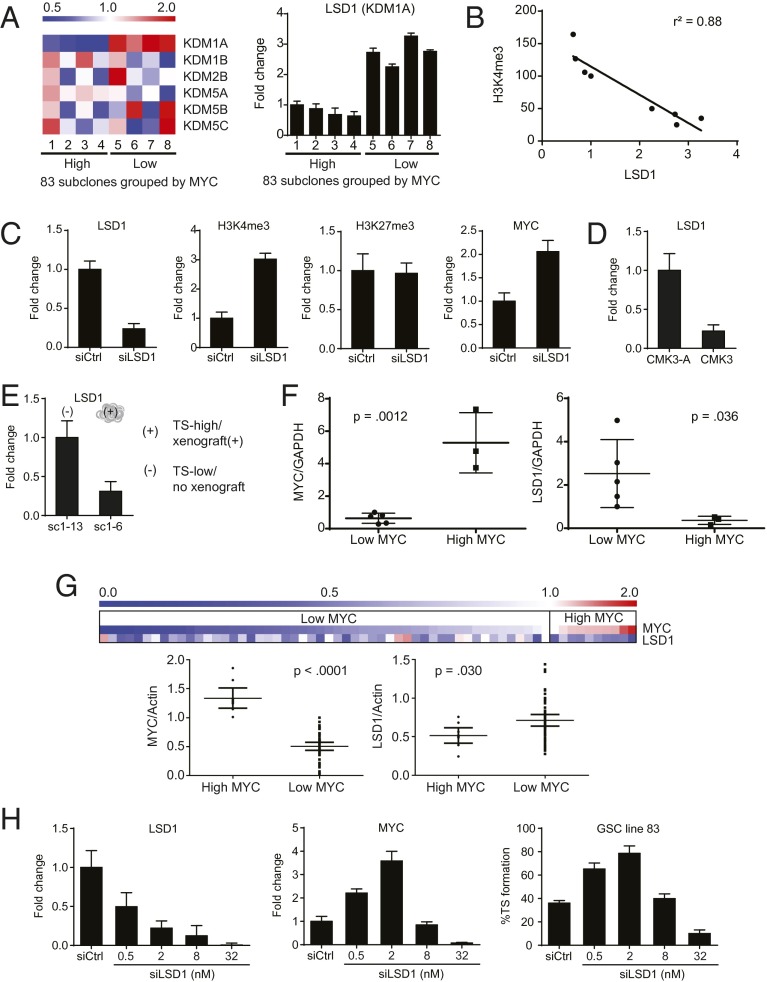
Fig. 5.
MYC locus H3K4me3 and MYC expression are associated with LSD1 expression. (A) Assessment by RT-PCR of relative expression of six H3K4-specific histone lysine demethylases in subclones of the glioblastoma line 83 grouped by MYC expression, shown as a heat map with blue designating below average expression and red designating above average expression. Only LSD1 (KDM1A) showed statistically significant association with MYC expression (Right). Error bars, SD. (B) Correlation of MYC locus H3K4me3 abundance and LSD1 expression in subclones of the 83 glioblastoma cell line. Correlation was analyzed by linear regression. (C) LSD1 siRNA silencing in U87MG induced accumulation of H3K4me3 at the MYC locus and MYC expression (RT-PCR) without affecting H3K27me3 abundance (ChIP). (D) Culturing conditions that suppressed CMK3 tumorigenicity (CMK3-A) induced LSD1 expression (qRT-PCR). (E) A tumorigenic U87MG-SC1 subclone (sc1–6) showed decreased LSD1 expression relative to a nontumorigenic subclone (sc1–13; Fig. 1C, exp 2). (F) Association between MYC and LSD1 expression (qRT-PCR) in eight freshly resected glioblastoma specimens. Error bars, SD. (G) Assessment by RT-PCR of MYC and LSD1 expression in single cells isolated from one freshly dissected glioblastoma specimen, shown as a heat map with blue designating below average expression and red designating above average expression (Top). LSD1 expression levels are grouped by high versus low MYC expression (Bottom), demonstrating that high MYC-expressing cells harbored lower LSD1 expression (P = 0.03). Error bars, 95% confidence interval. (H) Titration of LSD1 knockdown in 83 by increasing amounts of LSD1 siRNA, assessed by RT-PCR (Left). (Center) Corresponding MYC expression assessed by RT-PCR. (Right) Percentages of single-cell suspensions of 83 cells that propagated as TSs following graded LSD1 knockdown. All error bars, SD.

