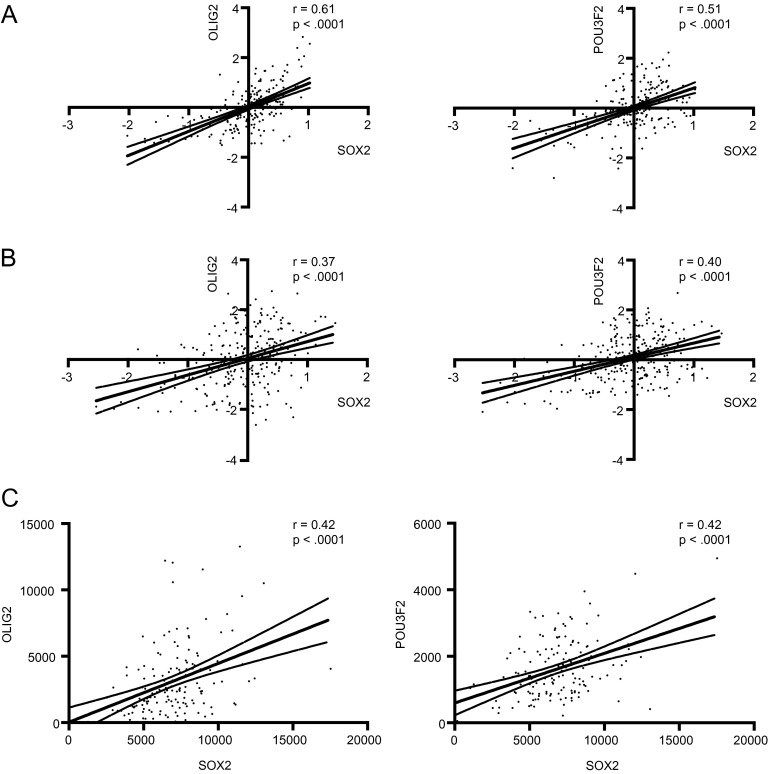
Fig. S6.
Correlation of SOX2, OLIG2, and POU3F2 expression in human glioblastoma specimens, using published microarray and RNAseq gene expression data. (A) TCGA microarray dataset (70). (B) Validation dataset comprised of four publically available datasets used in Verhaak et al. (70). (C) TCGA RNAseq data of mostly nonoverlapping samples compared with A. All correlations were analyzed by linear regression. P values indicate significance of nonzero slope.

