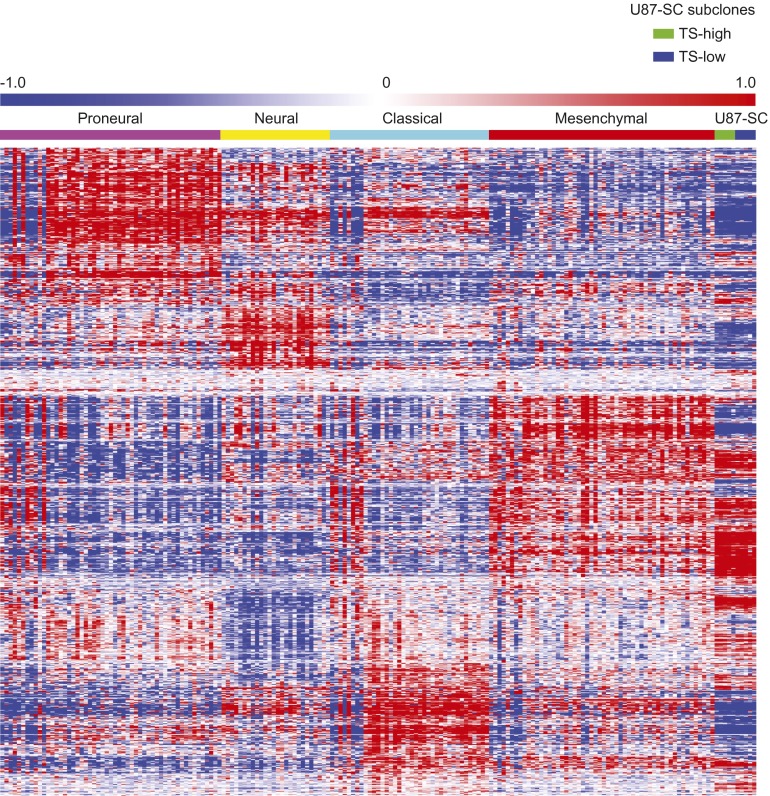
Fig. S9.
Heat maps showing hierarchical clustering of genes that comprise the TCGA molecular subtype classifier (70) for TCGA samples grouped by molecular subtype (70) compared with U87MG subclones grouped by high versus low TS-forming capacity, the latter to assess whether there are global differences in gene expression based on tumorigenic potential.

