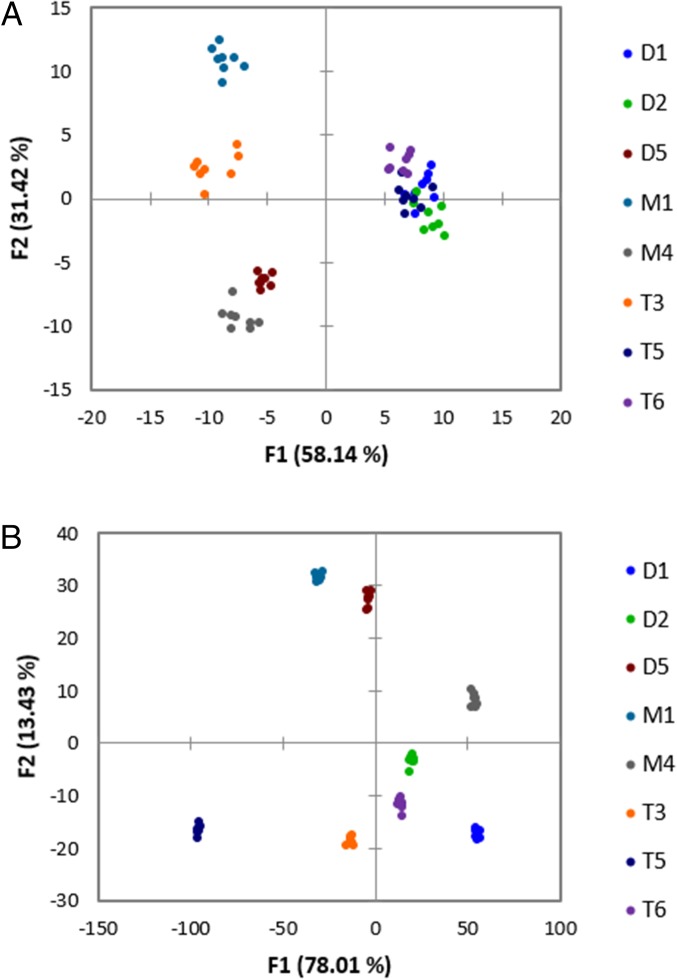
Fig. 3.
LDA plots of data collected from 96-well plates without olefin metathesis (A) and with olefin metathesis (B). (A) BSA and HSA (100 µM), glyceride (90 µM), DNSA (60 µM), ANS (60 µM), and NBD-FA (60 µM) in phosphate buffer with <2% (wt/vol) THF (see SI Appendix, Table S1 for read parameters) and (B) BSA and HSA (100 µM), glyceride (90 µM), DNSA (60 µM), ANS (60 µM), and NBD-FA (60 µM), metathesized glyceride (90 µM), AF (100 µM), and DNSA (60 µM) in phosphate buffer with <5% (vol/vol) THF (see SI Appendix, Table S4 for read parameters).

