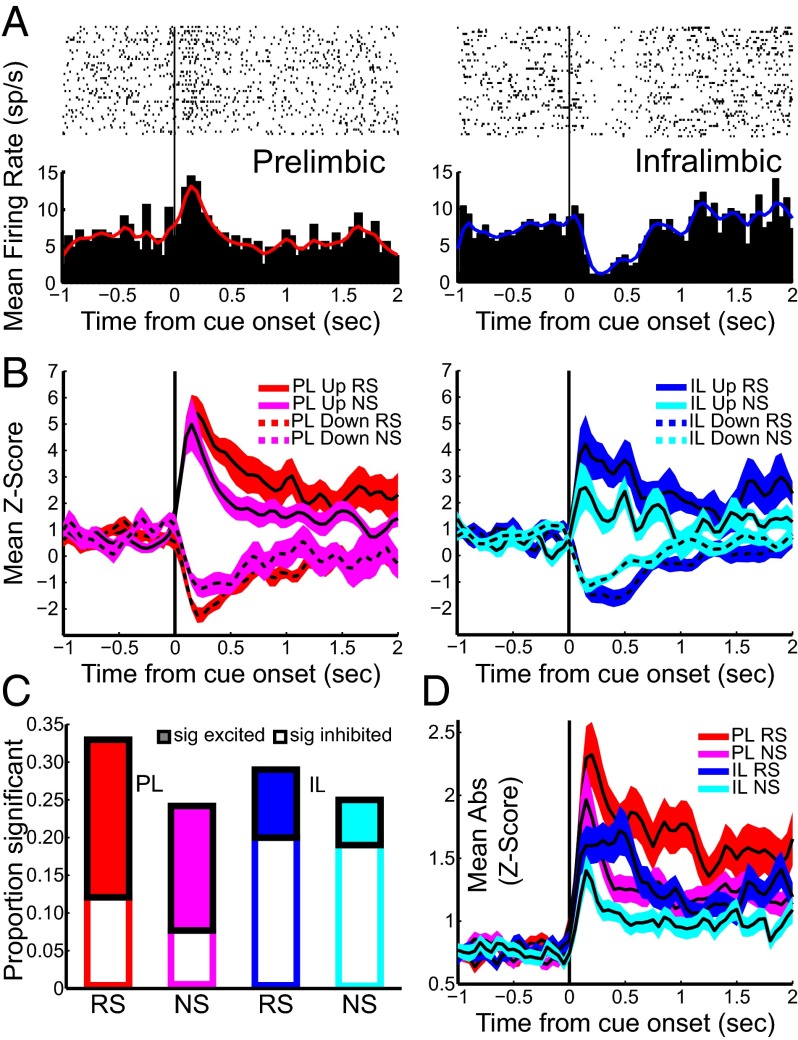
Fig. 2.
PL and IL neurons exhibited stimulus-evoked neural activity during DS-sucrose. (A) Single neuron examples of the prevalent response to RS presentation in each region. (B) Mean z-score activity for neurons that exhibited significant increases or decreases after RS or NS for PL (Left) or IL (Right) neurons. Solid/dashed lines represent activity of neurons with significantly increased/decreased activity, respectively. (C) Proportions of neurons that exhibited significant excitation (filled bars) or inhibition (empty bars) in response to RS or NS. (D) Mean absolute-value z-scores of all recorded neurons in response to RS or NS.

