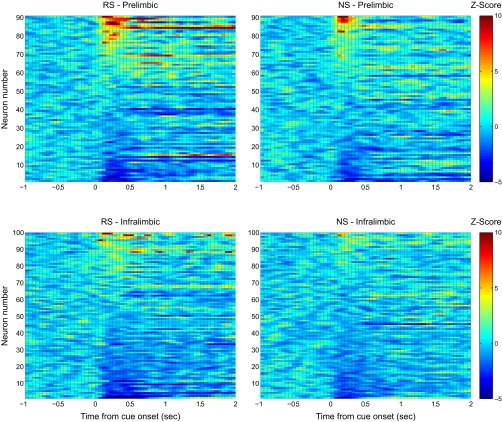
Fig. S2.
z-scored activity for all recorded PL (Top) and IL (Bottom) neurons during DS-sucrose illustrate the diverse stimulus-evoked responses in both regions. Activity is aligned on presentation of the RS (Left) or NS (Right). These data demonstrate that PL activity was approximately equally split between excitation and inhibition, whereas IL activity was primarily inhibited (although note some excitatory responses). In addition, the data show similar, although slightly weaker, evoked responses between RS and NS presentation.

