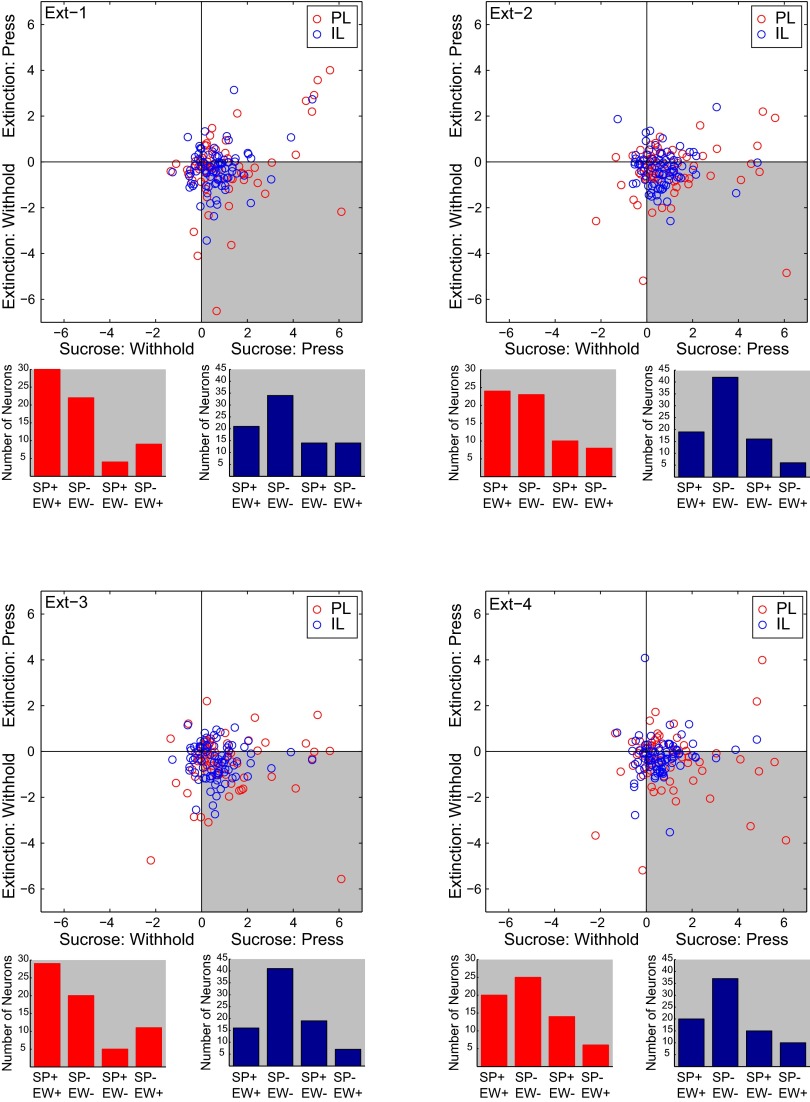
Fig. S4.
Neurons recorded in DS-sucrose and all four extinction sessions (PL, n = 65, IL, n = 72). Circles represent individual neurons (PL, red; IL, blue). For each neuron, we calculated an index of RS-evoked activity during press vs. withhold trials (SI Materials and Methods). Each figure represents a separate extinction session compared with DS-sucrose. Note that the majority of, although not all, neurons in PL and IL were strongly modulated for pressing during DS-sucrose and withholding during extinction. These points fall in the gray-shaded area. Data in scatter plots are based on absolute-value measurements of activity. Below each scatter plot is a measure of consistency of excitatory vs. inhibitory responses in each DS-sucrose pressing and extinction withholding. For neurons falling in the gray-shaded area, we measured whether neurons were excited or inhibited during DS-sucrose (when the animal pressed) and during extinction (when the animal withheld pressing). Note that, for both PL (red) and IL (blue), the majority of neurons were similarly modulated: excited or inhibited in both conditions (leftmost two bars). These data indicate that most individual neurons shifted their activity to represent pressing during DS-sucrose to withholding during extinction, and that these shifts in activity maintained the same valence of activity (excitation–excitation or inhibition–inhibition).

