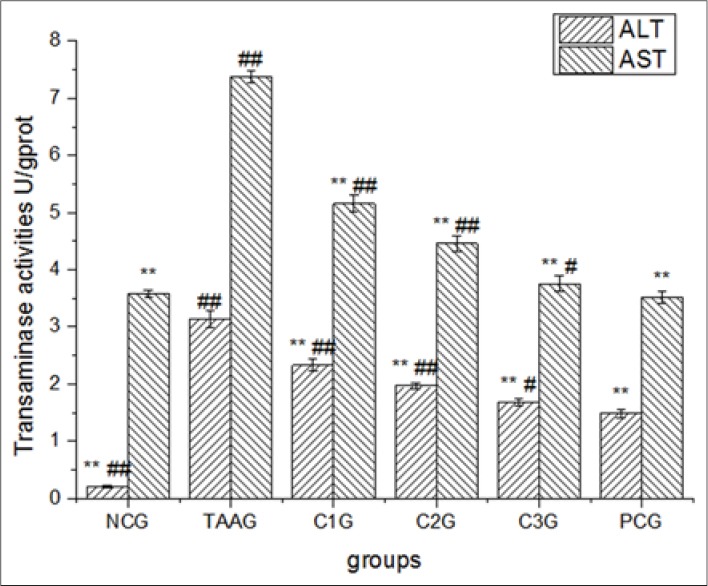
Figure 3.

Effect of calycosin-7-O-β-D–glucopyranoside for transaminase activities in BRL-3A cell supernatants. Values are expressed as mean ± standard error of the mean, while n = 3. *P < 0.05 compared to TAA groups (TAAG). **P < 0.01 compared to TAAG. #P < 0.05 compared to PCG. ##P < 0.01 compared to PCG
