
Figure 4.
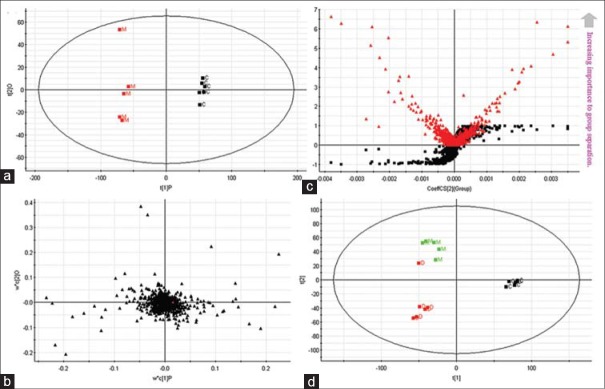
Establishment of the metabolic fingerprinting profiles of urine samples based on mass fragment profiles analysed by liquid chromatography/mass spectrometry system in negative ionization mode at 8th day. Principal components analysis (PCA) model results in negative mode (a). Loading plot of OPLS-discriminant analysis in negative mode (b). Panel (c) illustrates the combination of S-and VIP-score plots constructed from the supervised OPLS analysis (ESI − mode). (d) PCA scores plot of silybin affecting on acute liver damage rat group (ESI − mode)