
Figure 6.
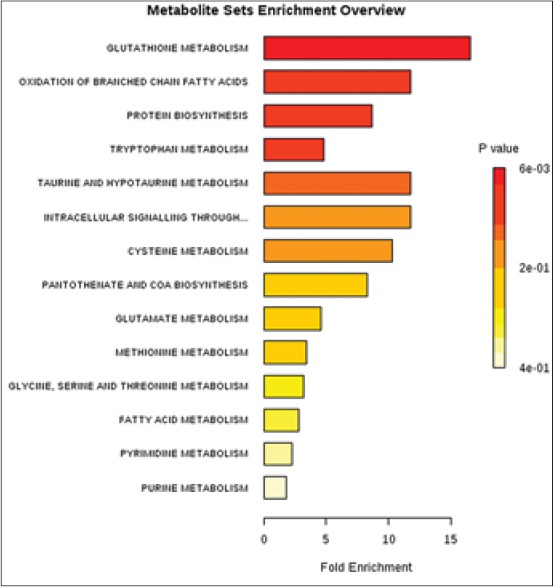
Summary plot for metabolite set enrichment analysis where metabolite sets are ranked according to Holm P value with hatched lines showing the cut-off of Holm P value
Official websites use .gov
A
.gov website belongs to an official
government organization in the United States.
Secure .gov websites use HTTPS
A lock (
) or https:// means you've safely
connected to the .gov website. Share sensitive
information only on official, secure websites.
Summary plot for metabolite set enrichment analysis where metabolite sets are ranked according to Holm P value with hatched lines showing the cut-off of Holm P value