Figure 3.

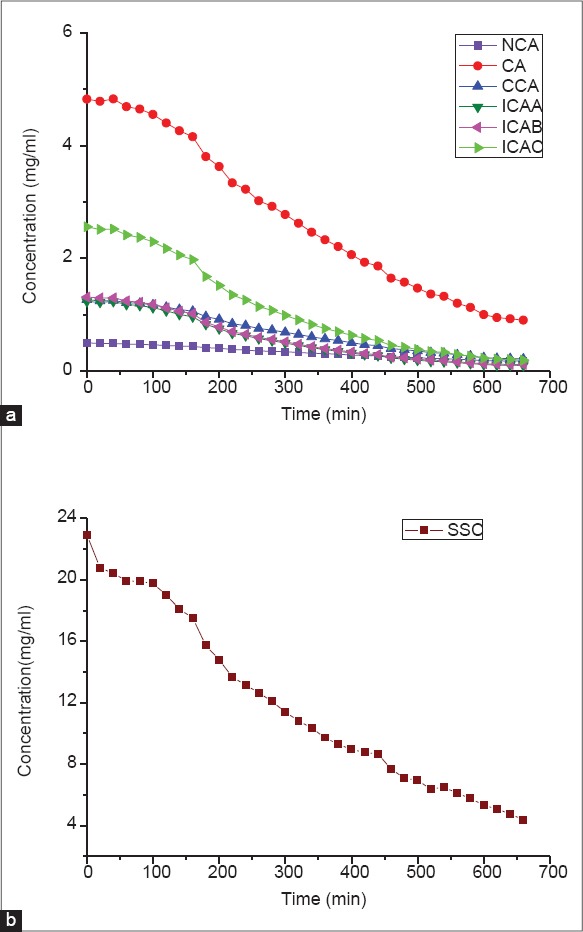
Time evolution curves of phenolic acids (a) and soluble solid content (b) of batch 140110 during liquid-liquid extraction of JQ

Time evolution curves of phenolic acids (a) and soluble solid content (b) of batch 140110 during liquid-liquid extraction of JQ