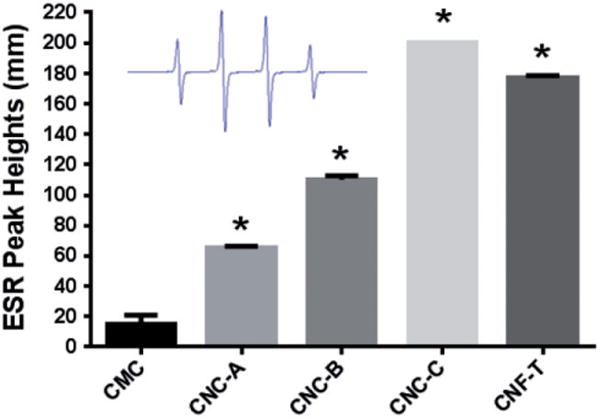
Figure 7.

Measured hydroxyl peak heights from the generation of short-lived ●OH radicals by cellulose particles upon reaction with H2O2. ESR spectrum recorded 3 min after reaction was initiated in PBS (pH 7.4) containing H2O2 (10 Mm) and DMPO (100 mM) vortexed for 10 s. ESR settings were center field, 3470 G; scan width, 100 G; time constant, 0.40 s; modulation amplitude, 1G; receiver gain, 2.52 × 10⁴; frequency, 9.754 GHz and power, 63 mW. Inset is a typical ●OH spectra observed. Asterisk denotes response significantly different from CMC.
