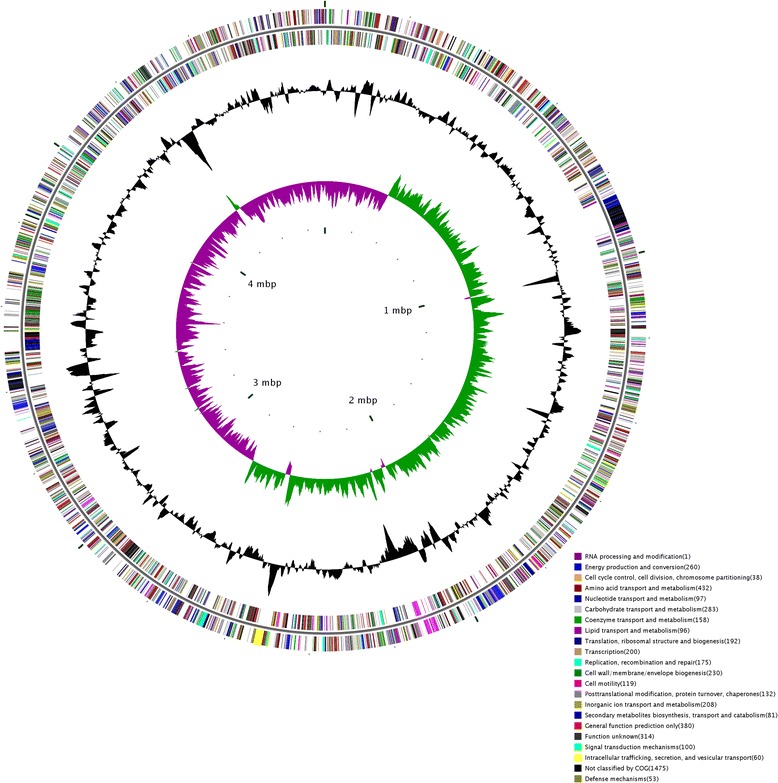
Figure 1.

Circular chromosome map of D. zeae strain EC1. The distribution of genes is shown on the two outer rings. The next circle (black) indicates the GC content and the central circle (green/purple) shows GC-skew value. The window size of the GC content and GC-skew is 100 nt.
