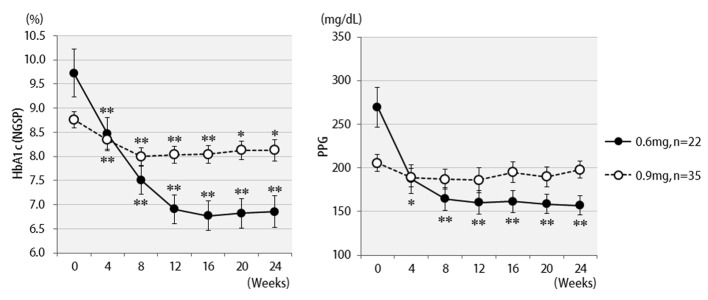
Figure 2.

Changes in HbA1c (NGSP), 2 h postprandial plasma glucose for 24 weeks by different liraglutide doses received: 0.6 mg (n = 22) or 0.9 mg (n = 35). **P < 0.001, *P < 0.05 compared with the values at baseline.

Changes in HbA1c (NGSP), 2 h postprandial plasma glucose for 24 weeks by different liraglutide doses received: 0.6 mg (n = 22) or 0.9 mg (n = 35). **P < 0.001, *P < 0.05 compared with the values at baseline.