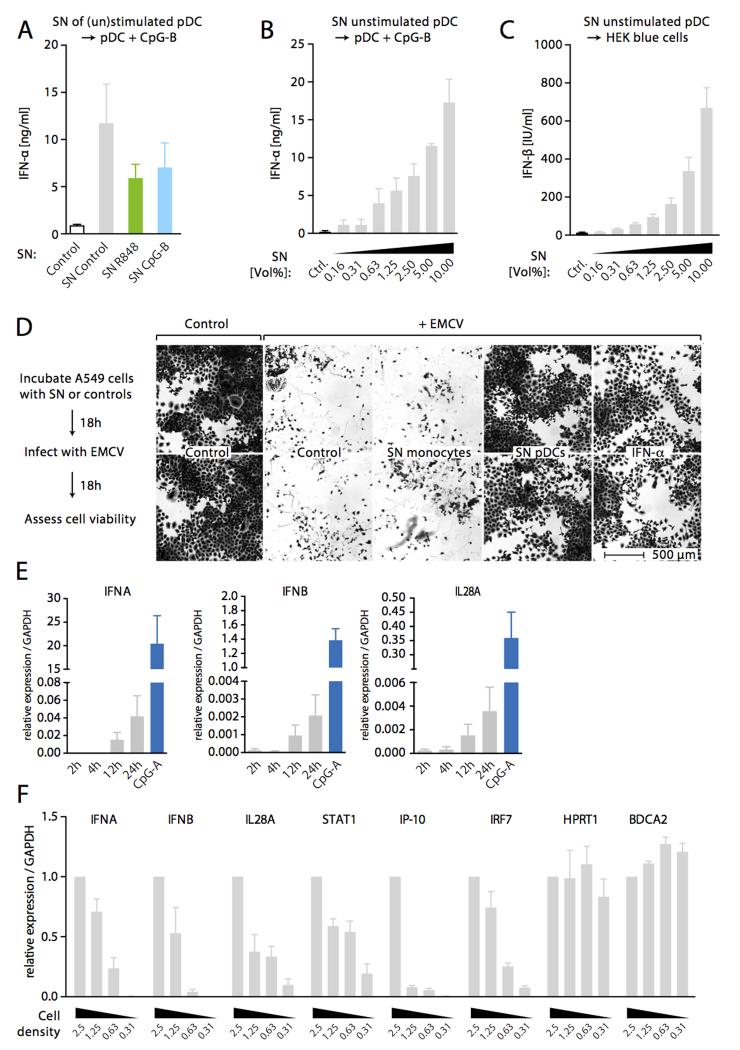
Figure 3.
Constitutive type I IFN production primes IFN-α responses in pDCs upon subsequent TLR-stimulation. (A) SN from pDCs that were incubated with CpG-B, R848, or medium for 24 h were collected and added to freshly isolated pDCs. After 3 h, pDCs were stimulated with CpG-B. IFN-α was measured after 36 h by ELISA. Results are shown as mean + SEM of five samples pooled from five independent experiments. (B) SN from medium-incubated pDCs were added onto freshly isolated pDCs at the indicated ratios. IFN-α was measured after 36 h by ELISA. Results are shown as mean + SEM of three samples pooled from three independent experiments. (C) SN of pDCs incubated in medium for 24 h were tested for the presence of type I IFN (IU/mL) using HEK-blue human IFN-α/β reporter cells. Results are shown as mean + SEM of four samples pooled from four independent experiments. (D) A549 cells were either left untreated or primed with 1 vol% SN of monocytes, 1 vol% SN of pDCs or 1 IU/mL recombinant IFN-α for 18 h followed by EMCV infection. After additional 18 h cells were stained with crystal violet and imaged using bright field microscopy (2.5× objective). Two independent visual fields per condition are depicted and data are representative of two independent experiments. (E) pDCs (100 000 cells/well) were incubated in medium for the indicated periods or stimulated with CpG-A for 12 h. mRNA-levels of IFN-α, IFN-β, IFN-λ2 (IL28A) were analyzed by real-time RT-PCR. GAPDH mRNA expression was used for normalization. Results are shown as mean + SEM of four samples pooled from four independent experiments. (F) pDCs were titrated starting at 2 500 000 cells/mL with serial dilutions (1:1) down to 312 500 cells/mL. After 24 h mRNA expression was assessed by quantitative RT-PCR and normalized to GAPDH mRNA levels. Results are shown as mean + SEM of three samples pooled from three independent experiments.

