
FIG. 6.
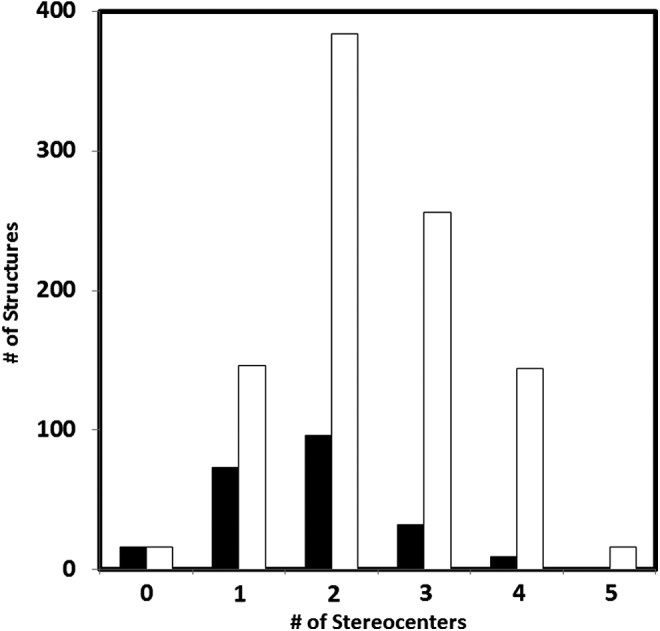
The number of structures with a given number of stereocenters of the output set. Black bars: number of connectivity isomers. White bars: number of total stereoisomers.
Official websites use .gov
A
.gov website belongs to an official
government organization in the United States.
Secure .gov websites use HTTPS
A lock (
) or https:// means you've safely
connected to the .gov website. Share sensitive
information only on official, secure websites.
The number of structures with a given number of stereocenters of the output set. Black bars: number of connectivity isomers. White bars: number of total stereoisomers.