
Figure 3.
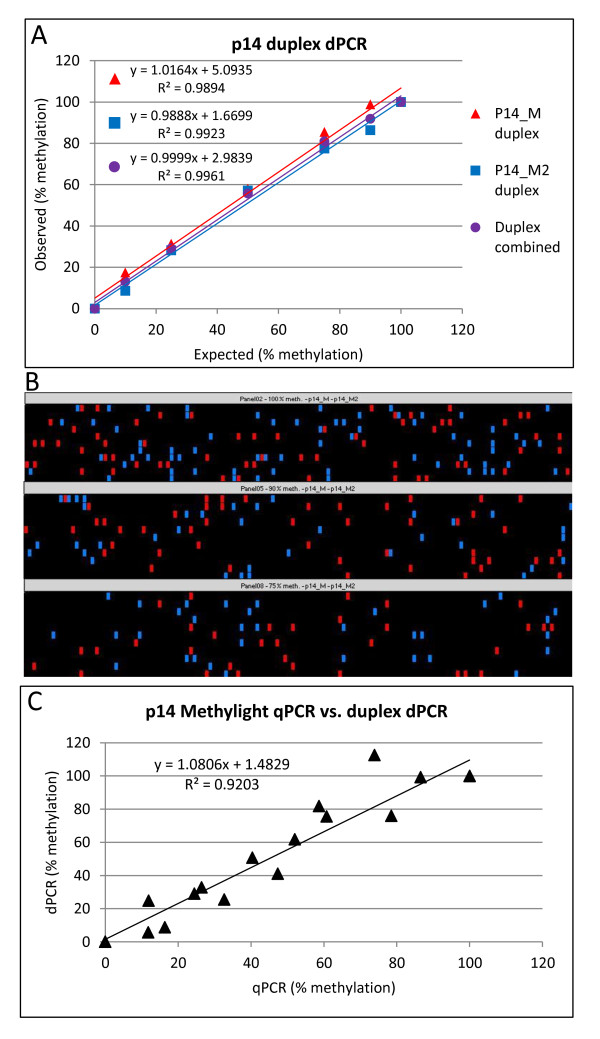
MethyLight duplex dPCR. (A) Duplex p14 dPCR assay showing data for p14_M and p14_M2 assays separately and with estimated targets for both assays combined. (B) dPCR heatmap showing distribution of p14_M (red) and p14_M2 (blue) positive chambers in a duplex reaction showing three example panels of a dPCR plate. (C) Correlation between MethyLight qPCR vs. duplex dPCR (estimated targets for both assays combined). All correlations were significant at p < 0.0001.