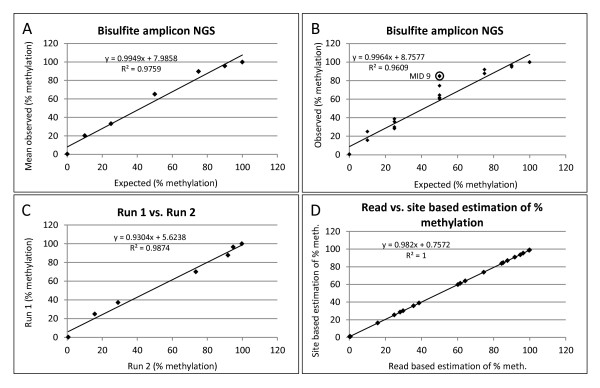
Figure 5.

Bisulfite Amplicon NGS. Analysis showing read-based estimates of percent methylation (A-C). (A,B) Correlation between expected and observed percent methylation showing (A) average percent methylation for all samples across both amplicon NGS experiments or (B) all data points plotted individually excluding Multiplex Identifier (MID)9 samples from the analysis in A and B. (C) Correlation between two bisulfite amplicon NGS experiments (including MID9). (D) Correlation between read- and site-based estimates of percent methylation. All correlations were significant at p < 0.0001.
