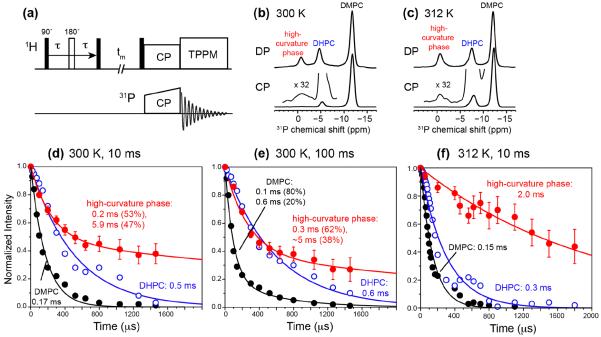
Figure 5.
31P-detected 1H T2 relaxation data of DMPC/DHPC bicelles containing M2TM-AH under the static condition. (a) Pulse sequence of the indirectly detected 1H T2 experiment. (b) Representative 31P DP and CP spectra with 1H spin diffusion mixing at 300 K. (c) Representative 31P DP and CP spectra with 1H spin diffusion at 312 K. The 31P chemical shifts differ between 300 K and 312 K for DMPC and DHPC peaks due to temperature-dependent exchange of DHPC between the planar and edge regions of the bicelle. (d) 1H T2 relaxation decays at 300 K after 10 ms 1H spin diffusion. (e) 1H T2 relaxation decays at 300 K after 100 ms 1H spin diffusion. (f) 1H T2 relaxation decays at 312 K after 10 ms spin diffusion. The DMPC, DHPC and high-curvature phase data are shown in black, blue and red, respectively.

