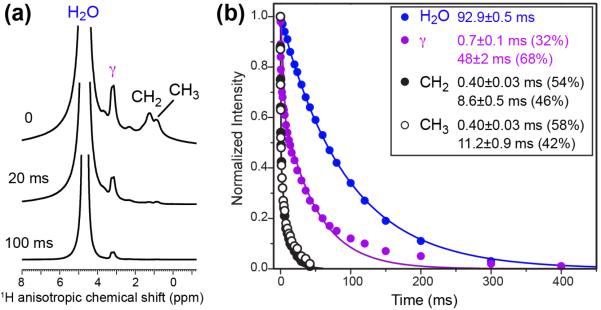
Figure 6.
Directly detected 1H T2 relaxation data of DMPC/DHPC bicelles containing M2TM-AH under the static condition at 302 K. (a) Representative 1H spectra with different echo delays. (b) 1H T2 relaxation curves with single or double exponential fits. The decay constants and the corresponding fractions are listed. The lipid relaxation times range from 0.4 to 50 ms, whereas the water 1H T2 relaxation time is much longer, 93 ms.

