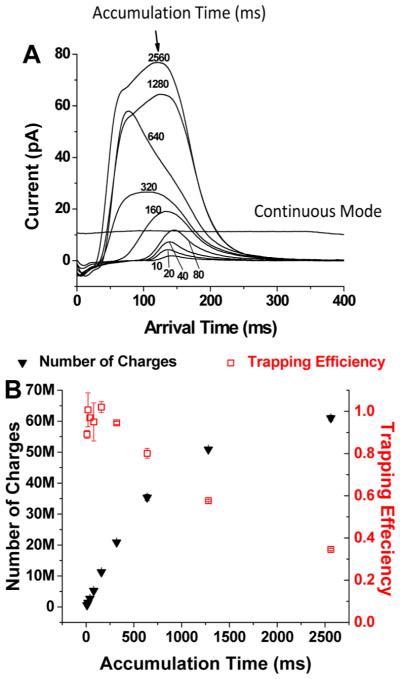
Figure 5.

Measurement of the charge capacity and trapping efficiency of the SLIM trap. (A) The current detected from ion pulses released from the SUM trap for different filling times (indicated). (Also shown is the typical measured continuous ion current ( 10 pA) and its stability in transmission mode.) (B) The numbers of accumulated charges (solid black triangles) and the corresponding trapping efficiency (open red squares). Error bars represent ± one standard deviation from the mean of triplicate measurements.
