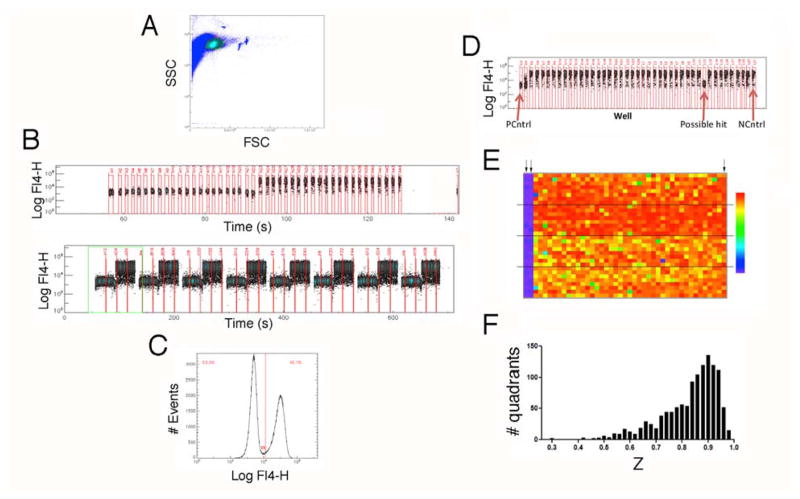
Figure 1. Screening the NIH’s MLSMR in 1536-well format with high-throughput cluster cytometry.
A) Plot of forward scatter vs. side scatter from an experiment validating the 1536-well format of the assay. The circled region represents live cells, which were selected for analysis. B) Representative data from row A (top) and the entire first quadrant (bottom) of a test plate in which half the columns contained unstimulated cells, while the other half contained stimulated cells. C) Histogram of FL-4 fluorescence for all live-cell events in a validation plate showing bivariate nature of the distribution of fluorescence corresponding to unstimulated (to the left of the line) and stimulated (to the right of the line) cells. D) Representative data from one row of a library screening plate. E) Heat map for a representative plate from the primary screening campaign. Arrows in the upper left indicate columns that were not stimulated to serve as positive controls. Arrow in the upper right designates stimulated negative controls. The color scale used to display data (indicated to the right) ranges from 0% response (purple) to 85% response (red). Dashed lines demarcate quadrants. E) Histogram of Z values for the 1208 quadrants analyzed.

