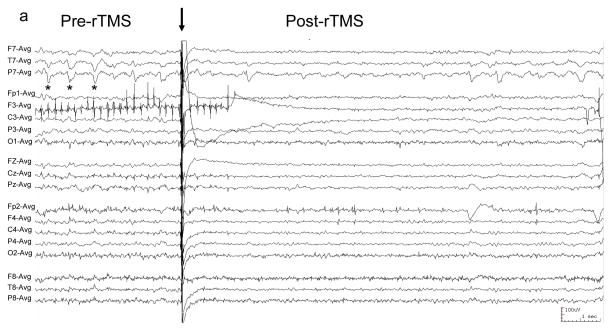
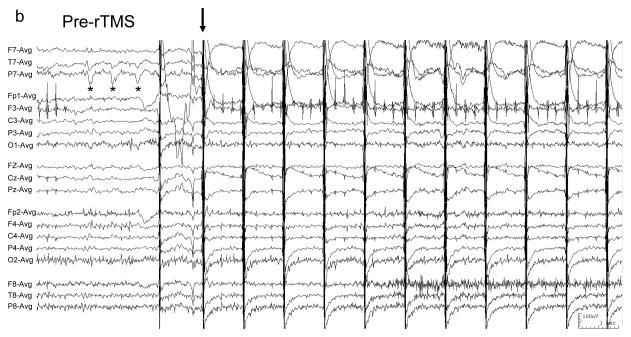
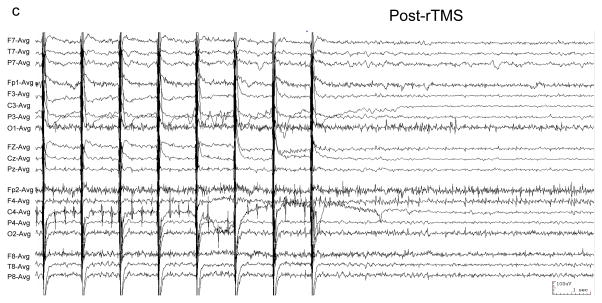
Figure 1. EEG of patient with EPC undergoing rTMS.
EEG was recorded with a conventional 10–20 international scalp electrode configuration, filtered 1–70 Hz, and displayed in a referential montage. “*” demarcates typical left temporal sharp waves. (a) 100 Hz rTMS was at 100% MO with figure-8 coil for 0.05 seconds (arrow). EEG following rTMS shows transiently-reduced sharp wave frequency. (b) Typical sharp waves (*) precede 1 Hz rTMS (arrow), and are absent (c) following rTMS.


