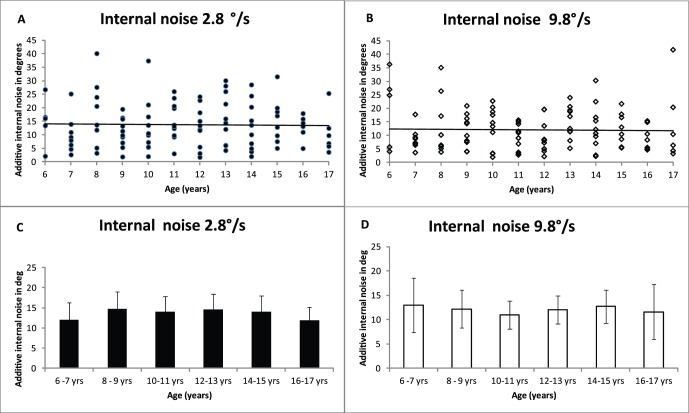
Figure 4.
Internal noise as a function of age at two different speeds. Figure A and B show the individual data for 2.8°/s and 9.8°/s speeds, respectively, showing regression lines for the individual data. Figure C and D show the mean data for participants binned according to age. Error bars show ±95% confidence intervals.

