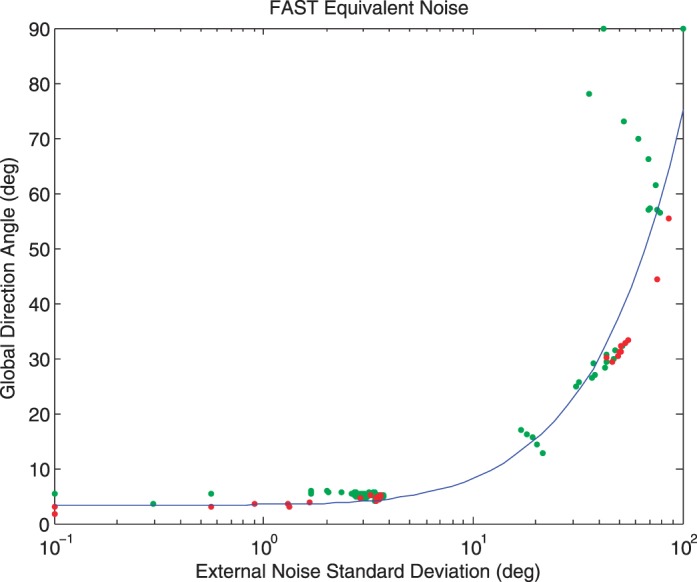
Figure A1.

EN Analysis measured with FAST in a simulated experiment with 100 trials. Each data point indicates the direction angle and external noise level on one trial: Green data points indicate trials on which the response was correct; red points represent incorrect trials. The curve shows the best fitting EN function. See text for details.
