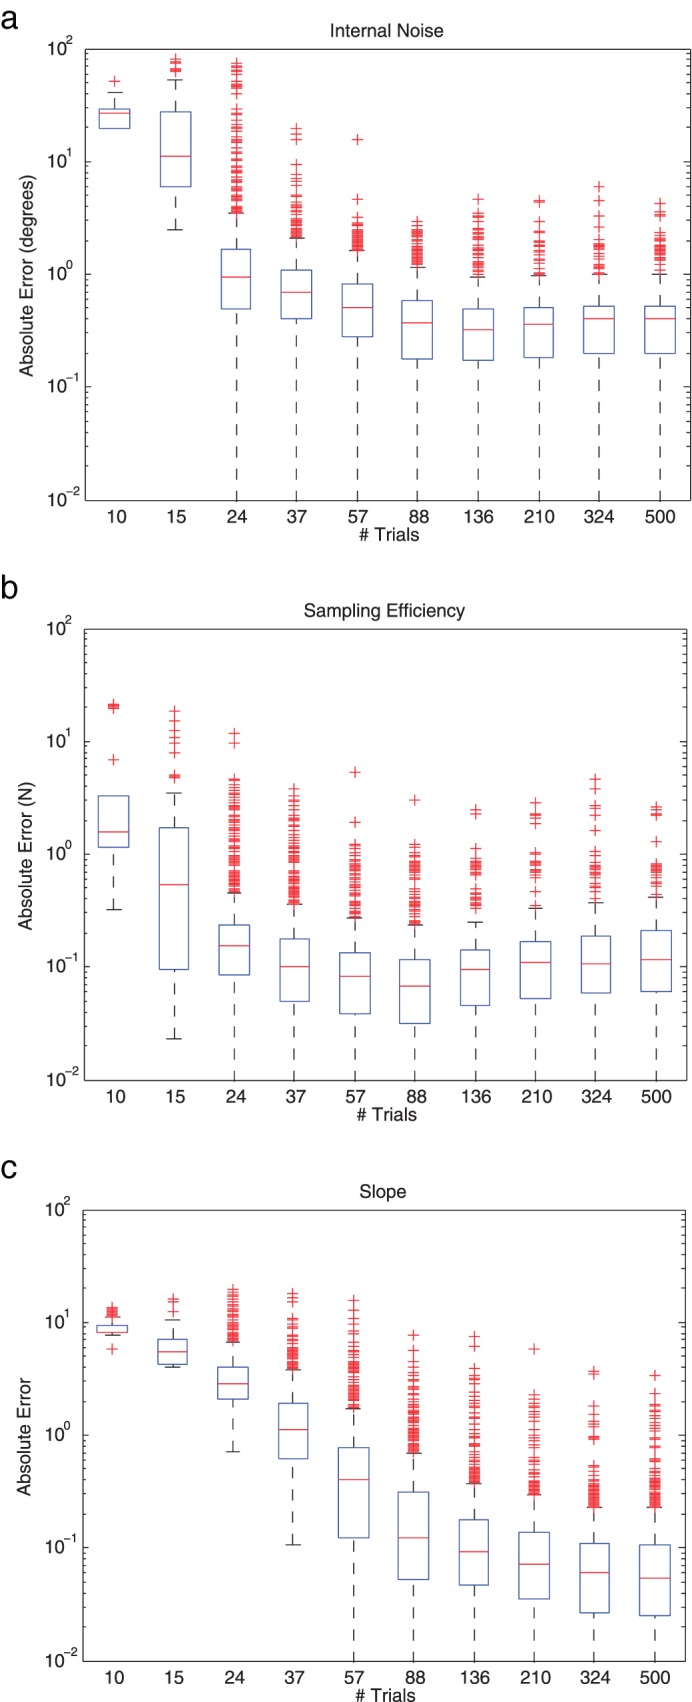
Figure A2.

Box plots of the error between the FAST estimate and the true value of (a) Internal Noise, (b) Sampling Efficiency, and (c) Psychometric Function Slope as a function of the number of trials in an experiment. The central red line is the median, the edges of the box are the 25th and 75th percentiles, the black whiskers extend to the most extreme data points not considered outliers, and red plus symbols indicate outliers, determined automatically by MatLab.
