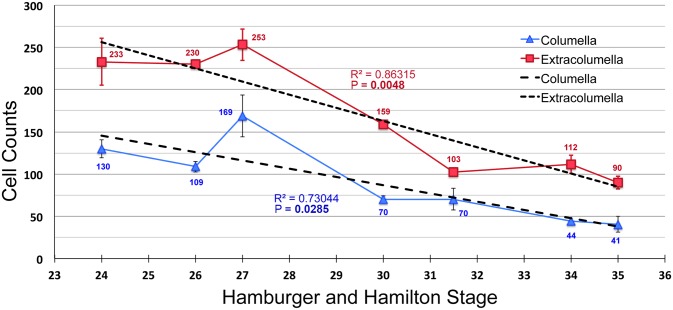
Fig 3. Cell density decreases during pharyngeal mesenchyme condensation.
A graph of normalized cells counts showing cell density in the columella (blue) and extracolumella (red) between HH24 and HH35. The columella has lower density than the extracolumella at all time points. At HH27 there is a slight, but not statistically significant increase in cell numbers. Overall, there is a trend towards lower density over time. The rate of density reduction in the extracolumella is higher than that of the columella, R2 = 0.86 and 0.73, respectively. P values for the linear regression for extracolumella and columella are significant at 0.0048 and 0.0285, respectively. Bold font indicates significant P value.

