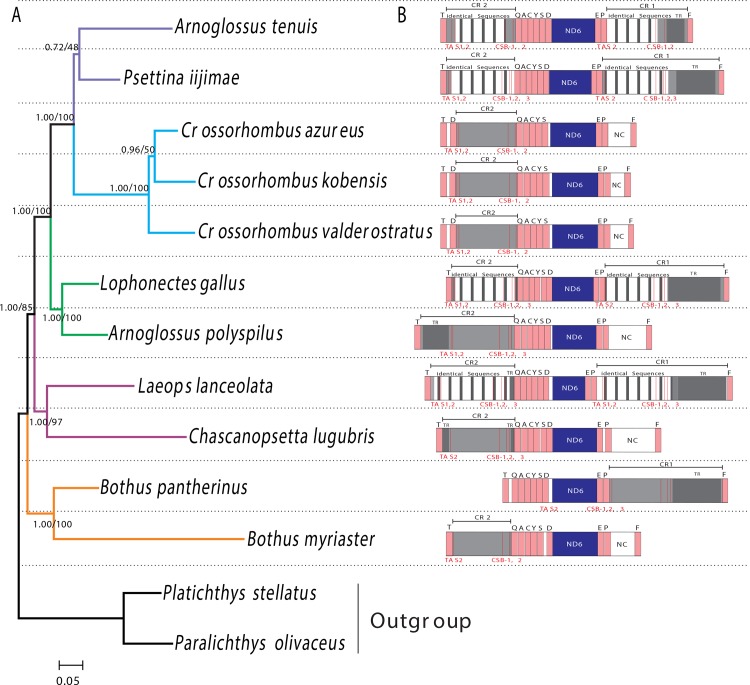
Fig 1. (A) Phylogenetic tree for 11 bothids with two other flatfishes as outgroup using the 12RT dataset. The phylogenetic tree was reconstructed by maximum likelihood and Bayesian methods. The first number beside the internal branch indicates Bayesian posterior probability, the second one is the bootstrap value. (B) Gene orders of fragments between tRNA-T and tRNA-F from 11 bothid species.
Cross-hatched area in bold indicates the core region of duplicate CRs. Light-gray box indicates the Conserved Sequence Blocks (CSBs) and Termination-Associated Sequences (TASs); Dark-gray box indicates the Tandem Repeat Sequences (TRs); White box indicates the Non-coding region (NC).

