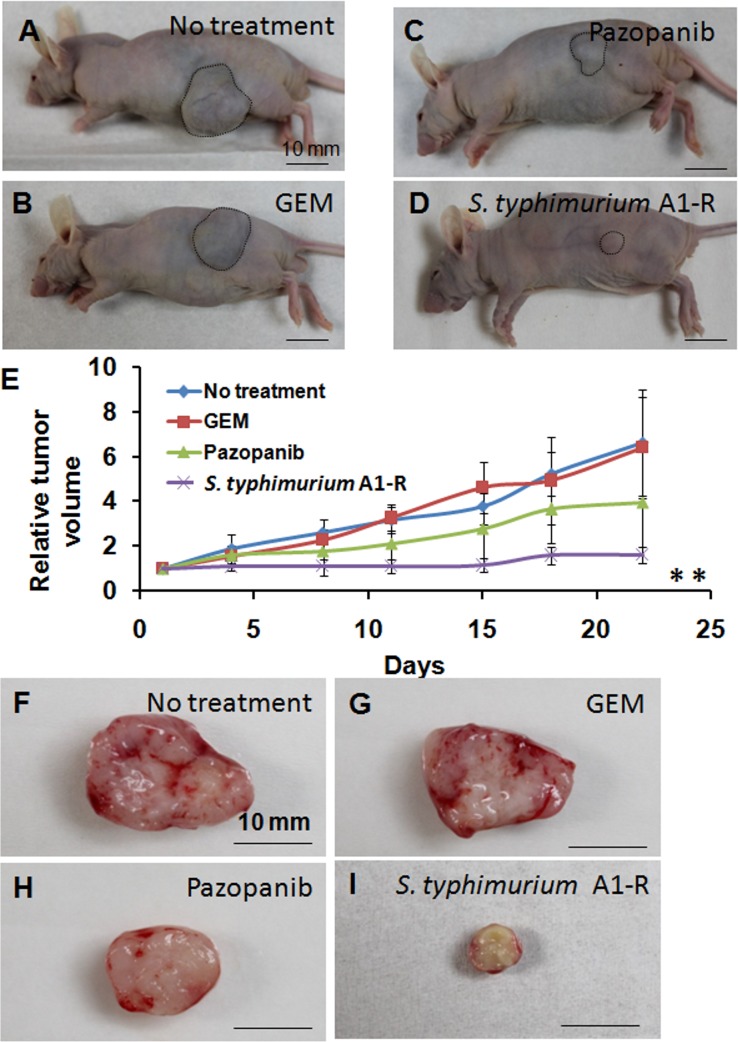
Fig 2. Drug-response of soft tissue sarcoma in nude mice.
A representative image of nude mouse with the subcutaneous sarcoma in (A) the untreated mice; (B) GEM-treated; (C) Pazopanib-treated or (D) Salmonella typhimurium A1-R-treated. Scale bars: 10 mm. (E) Growth curves of the subcutaneous sarcoma’s treated with various drugs as described above. The values are mean relative tumor volume ± S.D. (bars) of five different tumors. ** p < 0.01, compared to no treatment group. (F-G) Representative cross-sections of excised subcutaneous tumors from the control and treatment groups with type of treatment indicated.

