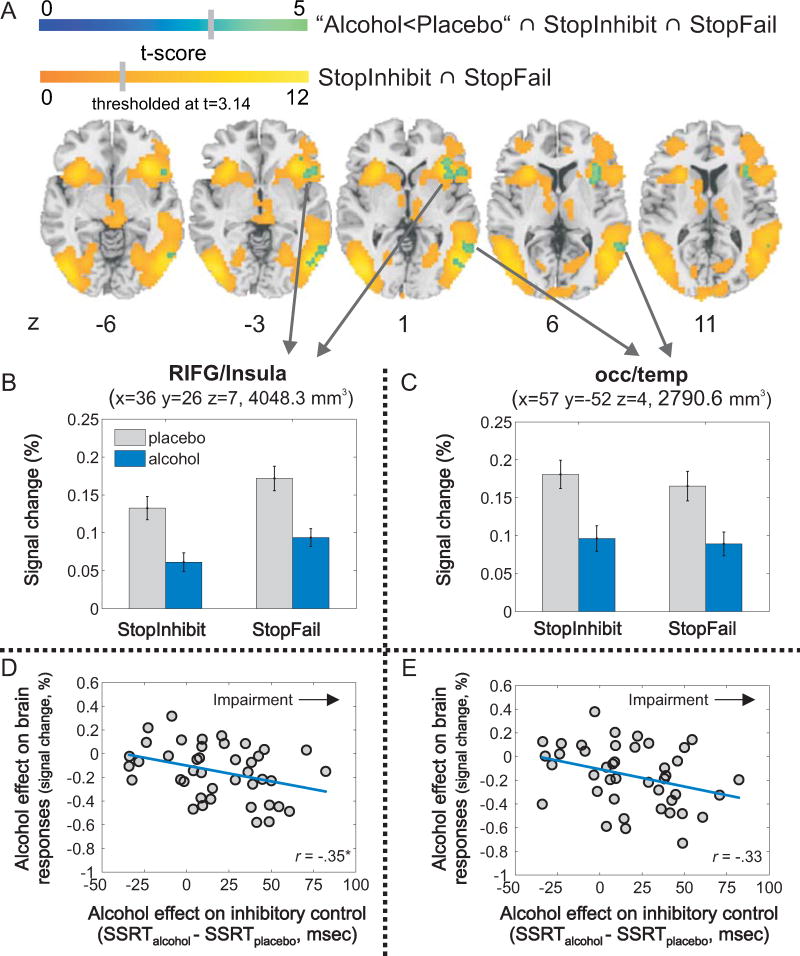
Figure 4. Whole-brain conjunction analysis.
(A) Alcohol effects (alcohol<placebo) on inhibition-related brain responses (StopInhibit ∩ StopFail). Brain maps showing the alcohol effect (blue color scale) overlaid on inhibition-related brain responses (yellow-orange color scale; significance threshold: p<.001 uncorrected, k>50). Mean brain responses for StopInhibit and StopFail (above the implicit go baseline) for alcohol and placebo are displayed for the two inhibition-related brain areas that exhibited decreased activation under alcohol in the whole-brain conjunction analysis: RIFG/insula (B), and the occipito-temporal cortex (C). Regional analyses: Correlation between alcohol-induced impairment of inhibitory control (SSRTalcohol-SSRTplacebo; >0: impaired; <0: improved) and alcohol effects on regional inhibition-related brain responses in the RIFG/insula (D), and the occipitotemporal cortex (E). Error bars represent the standard error of the mean. Locations are given in MNI-space. Abbreviations: mm3 = cubic millimeter, ms = milliseconds, occ/temp = occipito-temporal cortex, r = Pearson correlation coefficient, RIFG = right inferior frontal gyrus, SSRT = stop-signal reaction time, * = p <.025 (α-level corrected for multiple testing, p=.05/[number of tests=2]).

