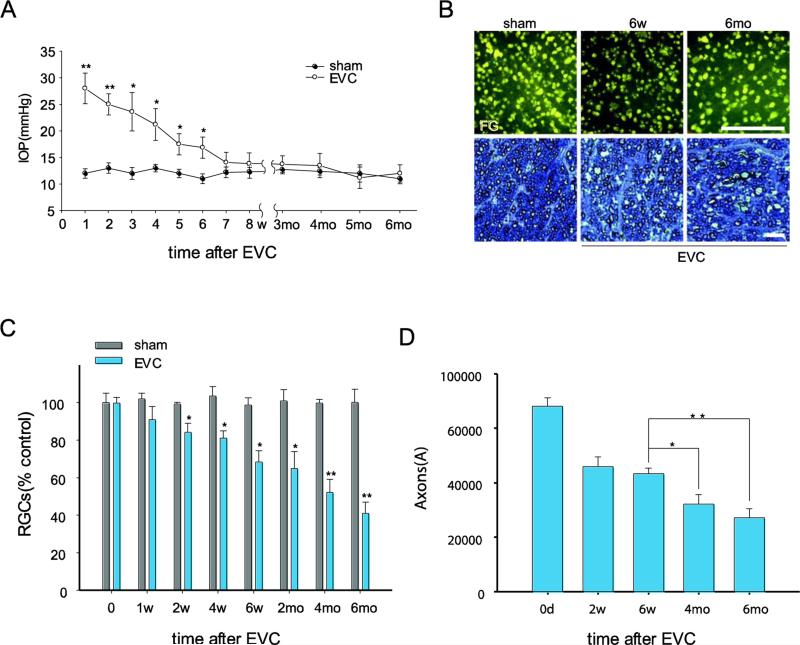
Fig. 1.
EVC-induced IOP elevation leads to a progressive loss of RGCs and their axons, even after the IOP has returned to normal levels. A, Time course of IOP after EVC (n=40/time point). IOP elevation was observed at 1 day and was sustained for 6 weeks after EVC treatment. B, Representative photographs of FG-labeled RGCs in flat-mounted retinas (top panels, scale bar, 100 μm) and toluidine blue staining of optic nerve cross-sections (bottom panels, scale bar, 100 μm). C, D, Quantitation of FG-labeled RGCs (C) and axons in the optic nerve (D) in EVC-treated eyes during IOP elevation and after return of the IOP to normal levels (n=8/time point). The values are the means ± SEMs. *p<0.05 and ** p<0.01 compared with the contralateral sham operation control eye. EVC: episcleral vein cauterization. w: week, mo: month.

