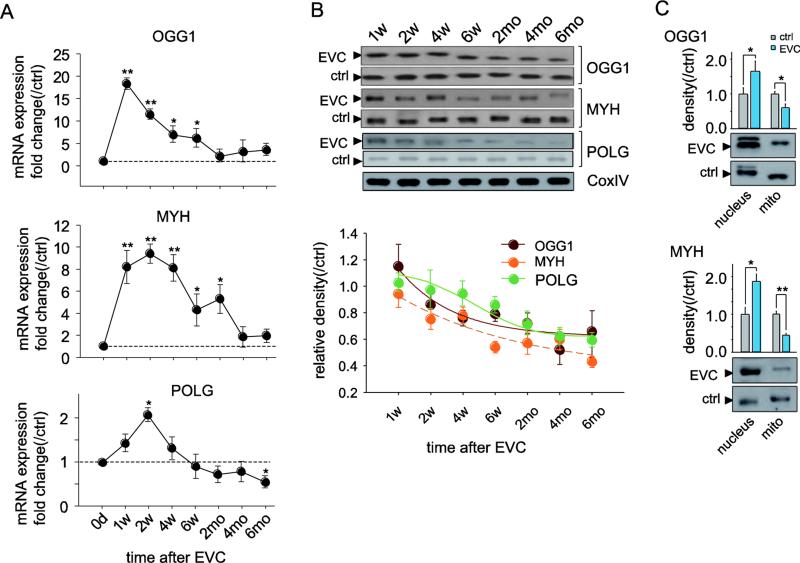
Figure 3.
Dynamic profile of the expression of mtDNA repair/replication enzymes in the RGCs of EVC eyes. A, Real-time PCR analysis of the gene expression of OGG1, MYH, and POLG in isolated RGCs. The fold change relative to contralateral sham operation controls was calculated using the ΔΔCt method. B, Western blotting analysis showing that the protein expression of OGG1, MYH, and POLG in the mitochondria of RGCs decreased after high IOP. CoxIV was used as an internal reference. The data are expressed as normalized ratios (Ctrl = 1). C, Western blots demonstrating the disparity in OGG1 and MYH protein expression in the mitochondria and in the nucleus 6 months after EVC. For each, the values are the means ± SEMs (n=22–24 retinas/group). *p<0.05, **p<0.01 compared with the contralateral sham operation control. mito: mitochondria. w: week, mo: month.

