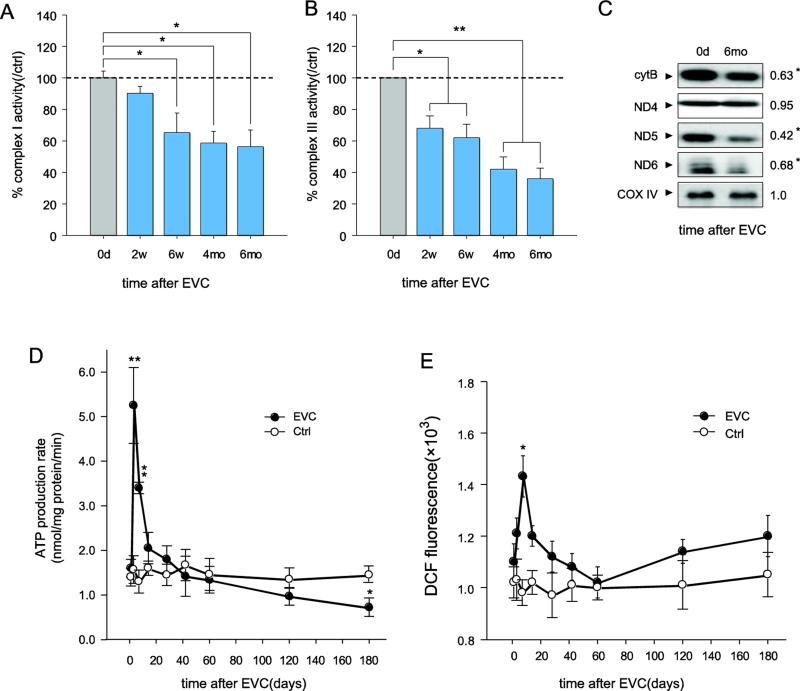
Fig. 4.
Accelerated mitochondrial dysfunction in the RGCs of EVC eyes, even after the reversal of IOP elevation. A, B, Complex I and III activities in the mitochondria of isolated RGCs decreased after EVC by measuring the consumption of NADH at 340 nm for complex I (A) and the reduction of cytochrome C at 550 nm for complex III (B). Values for the mitochondria of RGCs from the contralateral sham-operated control were set at 100%. C, Quantitative analysis of the mtDNA-encoded proteins ND4, ND5, ND6 and cytochrome b by western blot. CoxIV was used as a control. The value is the 6 month/0 day band density ratio. D, The ATP production rate in mitochondria isolated from RGCs was analyzed using a luciferase-based assay. E, The ROS concentrations in the RGCs were measured with the dye DCFH-DA. The values are the means ± SEMs. *p<0.05, ** p<0.01 compared to the contralateral sham operation control. RGCs isolated from 7-8 retinas were pooled to obtain 1 sample, and 3 samples (n=21–24) were used for each time point per group.

