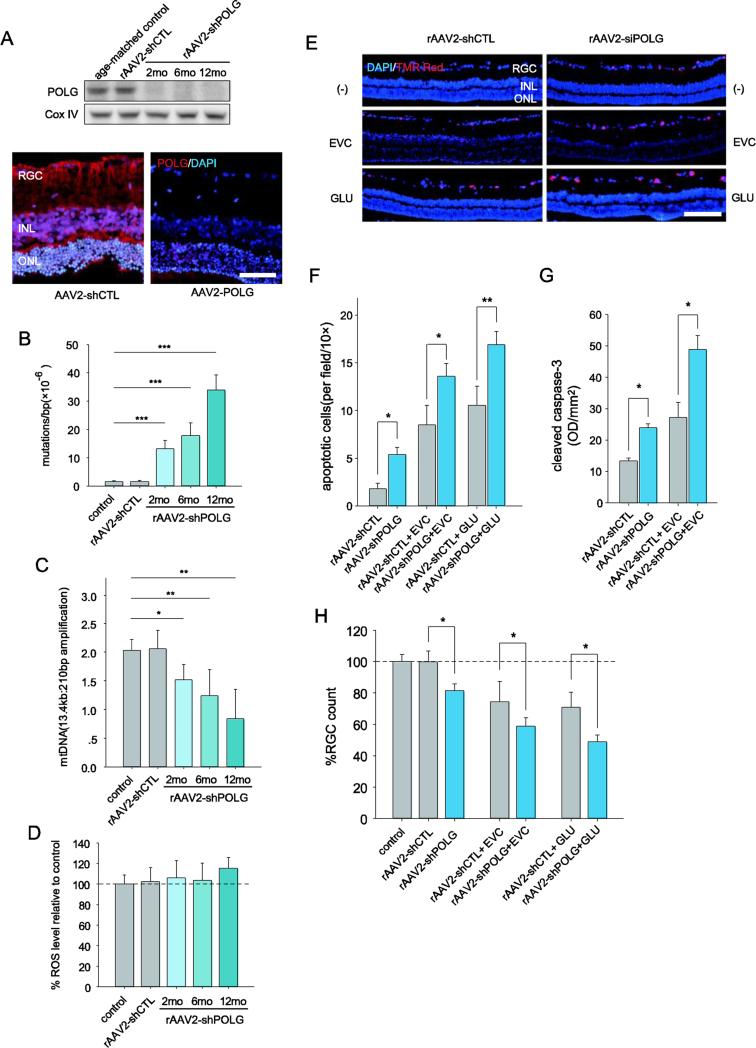
Fig. 6.
RGCs with increased mtDNA damage and mutations are not only prone to apoptosis but also have an increased vulnerability to IOP or glutamate challenge. A, Western blot analysis of POLG expression in the mitochondria of RGCs after AAV-shPOLG treatment (upper panel). Immunofluorescence staining showed POLG expression increased at 1 year after intravitreal injection of AAV2-shPOLG (lower panel). Red: POLG; blue: DAPI. Scale bar: 50 μm. B, C, Quantitative analysis of mtDNA mutations at position 8,335 of mtDNA (B) and damage (C) in RGCs after intravitreal injection of AAV-shPOLG using random mutation capture assay and LX-PCR, respectively. D, The ROS levels in isolated RGCs were determined using DCFH-DA dye. The values are expressed as percentages, with the values of the age-matched controls set at 100%. E, A TUNEL assay was used with in situ retinas to detect apoptotic cell death. Representative microscopic images showing TUNEL-positive cells in the retinas treated with AAV2-shPOLG alone; AAV2-shPOLG and EVC/glutamate; AAV2-shCTL alone; and AAV2-shCTL and EVC/glutamate. Red: TUNEL positive; blue: DAPI. Scale bars, 100 μm. F, Quantitative analysis of RGC apoptosis determined by TUNEL assay. The data are expressed as apoptotic cell counts. G, Determination of caspase-3 activation using an antibody to cleaved caspase-3 by western blot. The values were expressed as arbitrary OD units per unit area (OD/mm2) using ImageJ software. H, Quantitation of DiI-labeled RGCs in age-matched controls and those treated with AAV2-shPOLG alone; AAV2-shPOLG and EVC/glutamate; AAV2-shCTL alone; and AAV2-shCTL and EVC/glutamate. The data are presented as percentages, with the values from the age-matched controls set at 100%. All values in these figures are presented as the means ± SEMs, *p<0.05, ** p<0.01 (n=18–21 retinas/time point/group). EVC: episcleral vein cauterization. GLU: glutamate.

