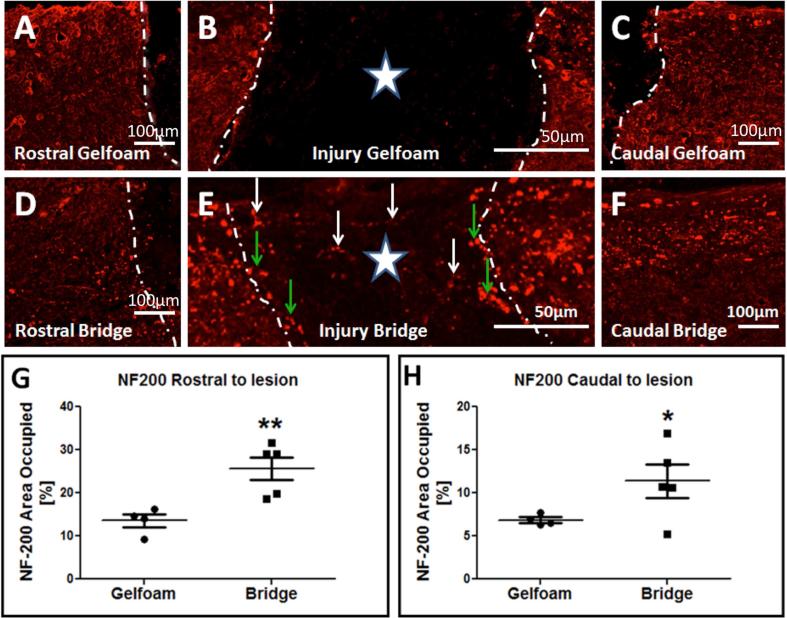
Figure 2. Axonal Neurofilament 200 (NF-200) immunoreactivity in mice receiving gelfoam control or bridge implantation.
In all panels, photomicrographs are from the horizontal plane, the region rostral to the lesion is to the left, and the region caudal to the lesion is to the right. Star indicates the lesion epicenter. White dashed lines indicate the bridge-tissue interface. (A-C) NF-200 immunoreactivity (red) in an animal that received gelfoam implantation. Note that NF-200+ axons are not observed in the implantation site (B). (D-F) NF-200 immunoreactivity (red) in an animal that received bridge implantation. Note that numerous NF-200+ axons are observed in the implantation site (E, white arrows), and at the rostral and caudal bridge-tissue interface (green arrows). (G-H) Quantification of the area occupied by NF-200 rostral (G) and caudal (H) to the lesion site in mice receiving gelfoam versus bridge implantation (mean ± SEM * p < 0.05, ** p<0.01; Student's t-test, n=5/group).

