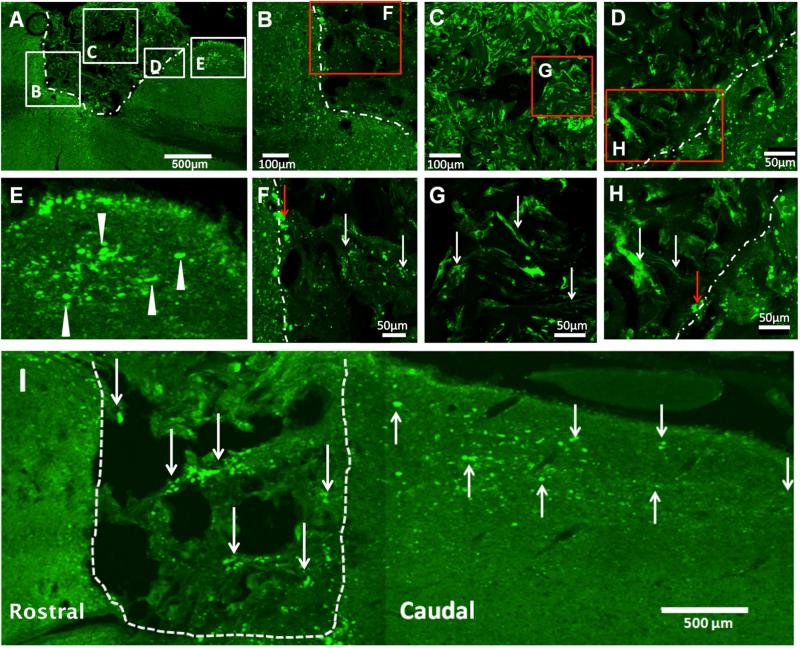
Figure 4. Crym:GFP labeled CST fibers traverse and exit the PLG bridge by 10 weeks post-SCI.
In all panels, photomicrographs are from the horizontal plane. Where the injury is shown, the region rostral to the lesion is to the left, the region caudal to the lesion is to the right, and the lesion site is oriented so as to be at the top. White dashed lines indicate the bridge-tissue interface. (A) Horizontal section of a Crym:GFP animal receiving bridge implantation; lettered boxes indicate regions shown at higher power in other panels. Note that Crym:GFP fibers (green) enter the bridge at the rostral bridge-tissue interface (A, B, and F), traverse through the bridge center (C and G), exit at the caudal bridge-tissue interface (D and H), and continue into the white matter parenchyma caudal to the bridge (E). In A-H, white arrows indicate GFP+ fibers within the bridge, white arrowheads indicate GFP fibers in the parenchyma caudal to the bridge, and red arrows indicate GFP+ fibers at the rostral or caudal bridge-tissue interface. (I) GFP-positive fibers were detected in the parenchyma caudal to the bridge at long distances (≥2500μm) from the caudal margin of the bridge. In I, white arrows indicate GFP fibers within the bridge and in the caudal parenchyma.

