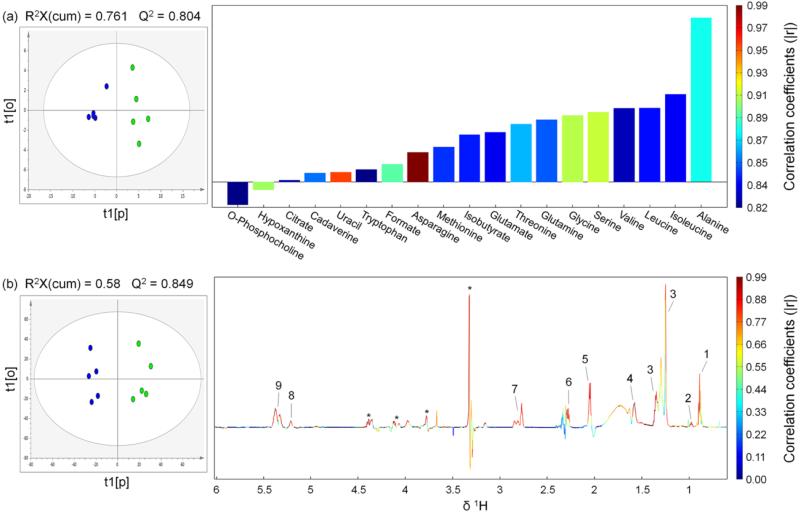
Figure: 2.
OPLS scores (left) and coefficients-coded loadings plot (right) of the model discriminating the control (blue dots) and the tumor (green dots) groups. (a) Using the hydrophilic metabolites concentrations obtained by spectral deconvolution (only metabolites with correlation coefficients |r| > 0.811 were plotted, correlation coefficients of all metabolites used for OPLS analysis were listed in Table S1 in Supporting Information). (b) Using the data derived from binning results of 1H NMR spectra from hydrophobic extracts. CV-ANOVA results gave p values of 0.0506 and 0.028 for models (a) and (b), respectively. A total of 2 components were extracted for both model (a) and model (b). R2, i.e. fraction of Y variation modeled by X, was 0.93 and 0.961 for model (a) and model (b), respectively. Lipids peak assignments in model (b): 1, CH3CH2CH2C=C; 2, CH3CH2; 3, (CH2)n, CH3CH2(CH2)n, CH2CH2CH2CO, CH2; 4, CH2CH2CO; 5, CH2C=C; 6, CH2CO; 7, C=CHCH2CH=C; 8, -CH=CHCH2CH=CH- (Unsaturated lipid), =CHCH2CH2; 9, =CHCH2CH2 (Unsaturated lipid). “Asterisk” indicates unassigned lipid contents

