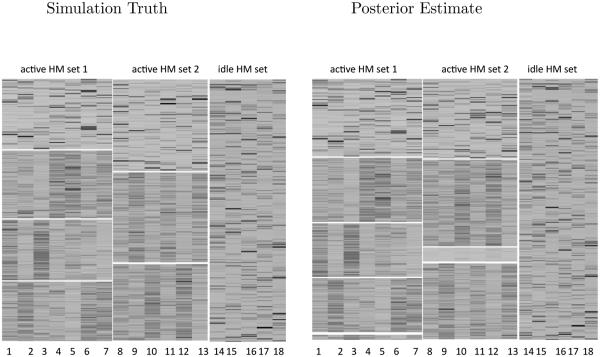
Figure 2.
Heatmaps of the HM sets in the simulation truth versus the identified HM sets under the NoB-LCP model. The first row block of each active HM set is the idle genomic location cluster for that HM set. The remaining blocks are active genomic location clusters. The division of genomic location clusters is indicated by white horizontal lines

