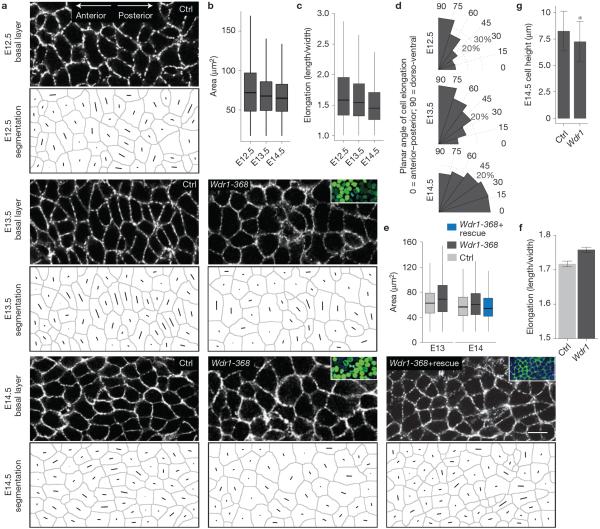
Figure 7.
Cell shape dynamics are regulated by Wdr1 and coincide with PCP establishment. (a) Representative whole-mount anti-E-cadherin immunofluorescence images of E12.5, 13.5 and 14.5 control backskins, imaged through the centre plane of cells within the basal layer. Each cell's shape and a line through its axis of elongation were computer-generated for quantifications. (b–d) Quantifications of data from a, n = 3,238 cells (E12); n = 2,984 cells (E13); n = 2,425 cells (E14) pooled from at least 4 embryos per condition. (b) For cell area, P = 3.9 × 10⁻⁶ (E12.5 versus E13.5); P = 6.7 × 10⁻⁶ (E12.5 versus E14.5); P = 0.0 (E13.5 versus E14.5). (c) For cell elongation, p = 0.0163 (E12.5 versus E13.5); P = 0.0 (E12.5 versus E14.5); P = 0.0 (E13.5 versus E14.5). (d) Histograms of cell orientation relative to the anterior–posterior axis. (e,f) Analogous experiments and analyses as in a–c except for Ctrl versus Wdr1-368 and Ctrl versus Wdr1-368+ rescue backskins, n = 3,695 (E13 scramble); n = 3,085 (E13 Wdr1 KD); n = 3,683 (E14 Ctrl); n = 4,316 (E14 Wdr1 KD); n = 2,565 (Wdr1KD+rescue) pooled from at least 3 embryos. For cell area in e, P = 2.2 × 10⁻¹⁶ (E13.5 Ctrl versus Wdr1-368); P = 6.6 × 10⁻¹⁴ (E14.5 Ctrl versus Wdr1-368); P = 0.127 (E14.5 Ctrl versus Wdr1-368), ANOVA followed by Tukey's HSD test. (f) Cell elongation for E14.5 Ctrl versus Wdr1-368 basal epidermal cells, P = 0.0008156 (unpaired t-test). (g) E14.5 basal progenitor cell heights were calculated from 10 μm sections, P = 0.0007 for Ctrl versus Wdr1 KD (unpaired t-test). Insets in a denote transduced cells (H2B−GFP+). Error bars represent mean ± s.e.m. For box plots in b, c and e, line: median, box: 50% range, whiskers: 1.5 × inter-quartile range. Asterisks indicate statistical significance at P < 0.05. Scale bar, 10 μm.

